Jul 17, 2026·8 min read
Fill Rate
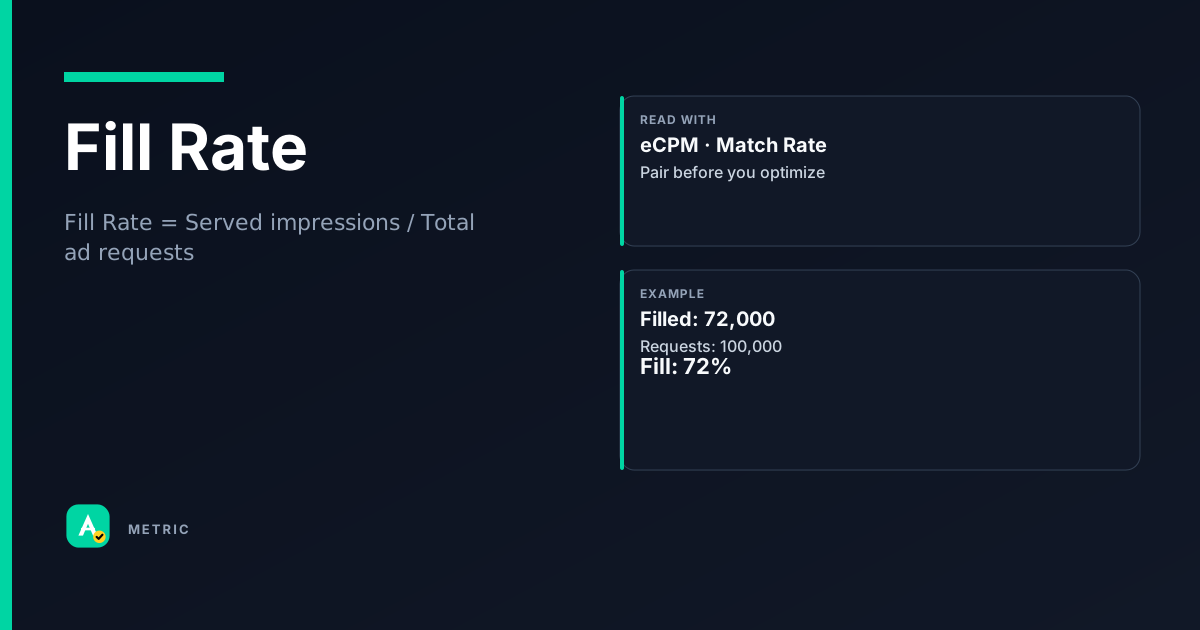
Fill Rate measures the percentage of ad requests that result in a served ad. It is a core supply-side metric that tells you whether your inventory is being monetized at all — but it says nothing about how well it is being monetized. A high fill rate paired with low eCPM can signal under-monetized inventory. Fill rate is often confused with match rate, which counts only programmatic responses that contain a bid.
What it is
Fill rate is the ratio of filled impressions (ads actually served) to total ad requests sent by a publisher’s inventory. It answers the question: Of all the opportunities I offered to the market, how many actually got a creative served?
In Google Ad Manager, the metric is typically computed as Served impressions / Eligible requests (programmatic) or Total impressions / Total ad requests (all channels). The exact denominator depends on whether you exclude non-eligible requests (e.g., due to frequency capping or roadblocks).
What fill rate does NOT tell you
- It does not measure revenue per request — that’s RPM.
- It does not measure bid density — that’s match rate.
- It does not measure viewability or quality of the fill.
So what: Fill rate is a necessary but insufficient metric. Use it as a signal of technical delivery health, not as a revenue optimization target.
How it is calculated
Fill Rate = Served impressions / Total ad requests
Example: If a publisher sends 1,000,000 ad requests and 920,000 ads are served, the fill rate is 920,000 / 1,000,000 = 92%.
Important caveats
- Denominator definition varies by platform. Google Ad Manager’s Programmatic Fill Rate uses Programmatic eligible requests as the denominator — requests that passed targeting, frequency capping, and roadblock checks. Other platforms may use all requests including those filtered out.
- Passback loops can inflate fill rate. If a waterfall chain eventually serves a house ad, that counts as fill even if no paying advertiser bought it.
- Header bidding wrappers may report fill differently. Some SSPs count a bid response as fill only if the creative renders; others count any response with a price.
- Timeouts matter. A request that times out before any response is counted as unfilled, which can depress fill rate on slow connections or complex auctions.
How to read it in a dashboard
A fill rate of 95%+ generally indicates healthy delivery — nearly every request is monetized. Below 80% you likely have a systemic issue: low demand, misconfigured price floors, or technical failures.
But never read fill rate in isolation. Always pair it with:
- eCPM — High fill + low eCPM often means you are filling with low-paying remnant or house ads.
- Match rate — If match rate is high but fill rate is low, the issue is likely after the bid (e.g., creative rendering failure).
- Viewability — Fill rate can be high while viewability is low if you are serving ads below the fold.
Common dashboard misread
A publisher sees fill rate jump from 88% to 96% after adding a new mediation partner and celebrates. But eCPM dropped 30%. The new partner filled cheap inventory that previously went unfilled — net revenue may be flat or down. Fill rate alone is a vanity metric without revenue context.
What usually moves this metric
Levers that increase fill rate
- Lower price floors — More demand passes, but at lower CPMs. Use floor optimization tools to find the sweet spot.
- Add demand sources — More SSPs, exchanges, or mediation partners increase competition and fill.
- Enable passback / house ads — Ensures every slot gets something, even if unpaid.
- Increase timeout windows — Header bidding timeouts that are too short cause unfilled requests. Balance against page load latency.
- Relax targeting constraints — Narrow geo or device targeting reduces eligible demand.
Levers that decrease fill rate
- Raise price floors — Filters out low bids, improving eCPM but potentially reducing fill.
- Add frequency caps — Reduces eligible impressions for repeat users.
- Stricter creative requirements — E.g., requiring MRAID or specific sizes may cause mismatches.
Tradeoffs
Fill rate vs. eCPM is the classic publisher tension. Optimizing fill alone can flood your inventory with $0.10 CPM ads. Optimizing eCPM alone can leave 30%+ of requests unfilled. The correct north star is RPM (Revenue Per Mille requests), which combines both: RPM = Fill Rate × eCPM.
Fill rate vs. latency — Longer timeouts increase fill but degrade user experience. A common mistake is setting a 2-second header bidding timeout to chase 99% fill, then watching bounce rates climb.
Formula
Google Ad Manager uses 'Programmatic eligible requests' as the denominator for programmatic fill rate. Always verify the denominator in your platform's documentation.
Scenarios
The cheap-fill trap
A news publisher saw fill rate drop from 94% to 78% after raising floors. Panic set in. They lowered floors back down and fill recovered to 96% — but eCPM fell 40%. What happened: The new floors had blocked only the lowest-paying demand. Lowering them brought back $0.05 CPM ads. Takeaway: Optimize RPM, not fill rate. A 78% fill rate at $3.00 eCPM yields higher revenue than 96% at $0.50 eCPM.
The timeout misconfiguration
A gaming site using header bidding had fill rate stuck at 72%. Match rate was 85%, so demand was bidding. Cause: The header bidding wrapper timeout was 400ms — too short for some SSPs to respond. Fix: Increased timeout to 800ms. Fill rate rose to 91%. Takeaway: Low fill with healthy match rate points to a post-bid failure, often timeout or creative rendering.
House ads masking a demand problem
A lifestyle blog reported 99% fill rate for months. Revenue was flat. What happened: Their ad server was filling 30% of impressions with house ads (zero revenue). The fill rate dashboard counted them as filled. Fix: Segmented fill rate by paid vs. unpaid. True paid fill was 69%. Takeaway: Always filter out house ads when evaluating monetization fill rate.
Common pitfalls
Chasing 100% fill rate
A perfect 100% fill rate is not a goal — it usually means you are serving unpaid house ads or extremely low-CPM remnant demand.
What to do instead:
- Set a target fill rate based on your RPM curve (e.g., 85-95% for premium inventory).
- Monitor paid fill rate separately from total fill rate.
Confusing fill rate with match rate
Fill rate counts served ads. Match rate counts bid responses. A high match rate does not guarantee high fill — bids may lose the auction or fail to render.
What to do instead:
- Use match rate to diagnose demand-side issues.
- Use fill rate to diagnose delivery-side issues.
Comparing fill rates across platforms without normalizing the denominator
One SSP may define fill rate as served / all requests while another uses served / eligible requests. The latter will always be higher.
What to do instead:
- Always check the platform’s metric definition before comparing.
- Use a unified reporting layer (e.g., Google Ad Manager or an analytics tool) to normalize.
Summary
Quick check
Confirm you understood this article.
boolean
Fill rate measures the percentage of ad requests that result in a served ad.
Select an answer to continue
Related metrics
References
- Google Ad Manager Help — Report metrics / Programmatic eligible requests (https://support.google.com/admanager/table/7568664) — conceptual reference
- IAB Digital Advertising Measurement Guidelines — conceptual reference for impression counting
- Publisher mediation and header bidding operations practice — conceptual reference for timeout and passback effects
For learning only. Not advice on bids or spend.
You may also like
Metrics
Effective Cost Per Mille (eCPM)
eCPM (effective cost per mille) is the revenue a publisher earns per thousand ad impressions, r…
RevenueMetrics
Match Rate
Match Rate measures the share of ad requests that receive at least one bid response from a dema…
SupplyMetrics
Viewability (Visible Impression Rate)
Viewability measures whether an ad had a reasonable chance of being seen by a human.
QualityMetrics
Take Rate (Platform Fee Share)
Take Rate is the percentage of transaction value that an ad platform (SSP, exchange, ad network…
Economics