Jul 17, 2026·8 min read
Effective Cost Per Mille (eCPM)
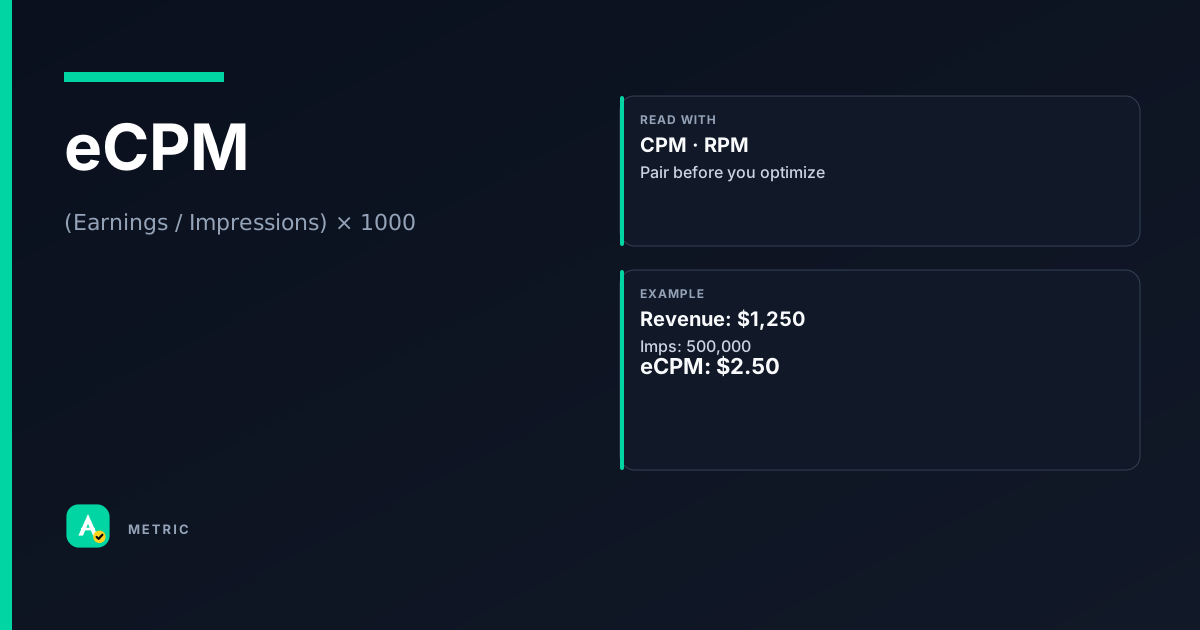
eCPM (effective cost per mille) is the revenue a publisher earns per thousand ad impressions, regardless of how those impressions were sold. It collapses CPM, CPC, CPA, and flat-fee deals into one comparable number. Unlike advertiser CPM (what the buyer pays), eCPM is the publisher’s side of the same coin — and it’s only useful when paired with fill rate and RPM.
What eCPM is
eCPM is the publisher’s average revenue per thousand impressions served. It answers: “For every 1,000 ad slots I filled, how much did I actually earn?”
Because publishers mix guaranteed CPM deals, programmatic auctions, and performance-based campaigns (CPC, CPA), eCPM normalises all of them into a single rate. Google Ad Manager reports average eCPM across channels specifically to let publishers compare monetisation sources on one scale.
What eCPM is NOT
- It is not the same as advertiser CPM. The buyer’s CPM includes ad-serving fees, data costs, and platform margins — the publisher’s eCPM is what lands in the bank after those deductions.
- It is not a yield metric on its own. A high eCPM on 10% fill is worse than a moderate eCPM on 90% fill. Always read eCPM together with fill rate and RPM.
How it is calculated
eCPM = (Total earnings / Total impressions) × 1000
Total earnings include all revenue from that ad slot or placement: CPM line items, programmatic bids, CPC commissions, and flat fees. Total impressions means the number of times the ad unit served (not requests, not fill).
Important caveats
- Impressions must be counted consistently. If one demand source counts a viewable impression and another counts a served event, the denominator changes. Use a single standard (MRC viewable or Google Ad Manager served count) across all channels.
- eCPM can be sliced by placement, device, geo, or time. A placement-level eCPM of $8.00 might hide a mobile eCPM of $3.50 and desktop eCPM of $12.00.
- Revenue net of fees. If your ad server deducts platform fees before reporting earnings, the eCPM shown is net. Always check whether the number is gross or net before comparing to advertiser CPM.
How to read it in a dashboard
A single eCPM number tells you almost nothing. The common mistake is to celebrate a $15 eCPM without checking whether fill rate dropped to 20%.
Read eCPM in context:
- Compare eCPM across comparable placements (same ad size, same device, same geo). A 300×250 eCPM on desktop in the US is not the same as a 300×250 eCPM on mobile in India.
- Track eCPM trend over time (daily or weekly). A sudden spike often means a high-paying deal ended or a low-paying channel dropped off — it’s not always good news.
- Pair eCPM with RPM and fill rate. RPM = (earnings / total pageviews) × 1000. If RPM is flat but eCPM rises, fill rate probably fell. If both rise, you’re genuinely monetising better.
Dashboard triad for publisher yield
- eCPM — revenue quality per filled impression
- Fill rate — how many requests actually got an ad
- RPM — total revenue per thousand pageviews (the ultimate business metric)
What usually moves this metric
Demand mix — The fastest lever. Adding a high-CPM programmatic buyer or switching a remnant deal to a guaranteed CPM can lift eCPM immediately. But watch for fill loss: some high-CPM buyers have strict inventory filters.
Ad quality and viewability — Buyers pay more for viewable, non-intrusive placements. Improving ad load time, reducing clutter, and using sticky units (within MRC guidelines) can increase bid density and eCPM.
Floor price strategy — Setting floors too high chases away demand and drops fill rate, which can actually lower RPM even if eCPM looks good. Setting floors too low leaves money on the table. The sweet spot is data-driven: test floors at the 70th–80th percentile of historical bid distribution.
Ad refresh and lazy loading — Refreshing ads on user engagement (scroll, click) can serve more impressions per session, but aggressive refresh can degrade UX and trigger ad fraud filters. Lazy loading (loading ads only when they enter the viewport) improves viewability and eCPM without harming experience.
Tradeoffs
- High eCPM + low fill → You’re leaving revenue on the floor. Lower floors or add a backfill network.
- High fill + low eCPM → You’re monetising volume but not value. Review demand sources and consider header bidding.
- Rising eCPM + falling RPM → Classic misread. RPM is the business metric; eCPM is a diagnostic. Fix fill before celebrating.
Formula
Google Ad Manager reports eCPM as net revenue after platform fees. Always confirm whether your dashboard uses gross or net earnings.
Scenarios
The high-eCPM trap
A publisher saw eCPM jump from $8 to $14 in one week. The team celebrated — until they noticed RPM had dropped from $6 to $4.
What happened: A high-CPM programmatic buyer activated but filtered out 60% of inventory. Fill rate fell from 75% to 28%.
What they did: Lowered the floor price for that buyer and added a backfill network for filtered impressions. eCPM settled at $10, but RPM rose to $7.
Takeaway: eCPM alone is vanity. Always pair with fill rate and RPM.
CPC campaigns inflating eCPM
A home-services advertiser ran a CPC campaign on a publisher’s DIY site. The campaign earned $0.50 per click and had a 5% CTR. The publisher’s eCPM from that campaign was $25 — far above the site average of $10.
What happened: The high CTR made the CPC campaign look like a premium CPM deal. But the campaign served only 20,000 impressions (low volume).
What they did: The publisher kept the campaign but capped its impression share to avoid cannibalising higher-volume CPM deals. They also tested a CPA model to see if the user quality justified the rate.
Takeaway: eCPM from performance campaigns can mislead if volume is low. Compare total revenue contribution, not just rate.
Floor price too aggressive
A news publisher set a $5 floor on all 300×250 placements. eCPM stayed at $5.50 — above the $4.00 industry benchmark. But fill rate dropped to 35%.
What happened: The floor was above the bid distribution for 60% of their inventory. Buyers either couldn’t bid or bid and lost.
What they did: Analysed bid landscape data and set dynamic floors at the 75th percentile per placement. eCPM dropped to $4.80, but fill rate rose to 78%, and RPM increased 40%.
Takeaway: Maximising eCPM with high floors can destroy total revenue. Let RPM guide floor decisions.
Common pitfalls
Confusing eCPM with advertiser CPM
eCPM is the publisher’s revenue per thousand impressions. Advertiser CPM is what the buyer pays. The difference includes ad server fees, data costs, and platform margins. What to do: When comparing rates, always note whether you’re looking at gross CPM (buyer side) or net eCPM (publisher side).
Optimising eCPM in isolation
A common Slack advice trap: “Raise floors to boost eCPM.” That works until fill rate collapses. What to do instead: Set a target RPM and optimise the combination of eCPM and fill rate. Use RPM as your north star, not eCPM.
Ignoring impression counting differences
If one demand source counts a served impression and another counts a viewable impression, your eCPM comparison is meaningless. What to do: Standardise on one counting method (e.g., Google Ad Manager served impressions) across all channels. Document the definition in your reporting.
Summary
eCPM is a powerful normaliser, but it’s a diagnostic metric, not a business goal.
- Always pair eCPM with fill rate and RPM to understand true yield.
- Slice eCPM by placement, device, and geo to find hidden opportunities.
- Optimise for RPM, not eCPM alone — a high eCPM with low fill is a revenue leak.
Quick check
Confirm you understood this article.
boolean
eCPM is the same as advertiser CPM.
Select an answer to continue
References
- Google Ad Manager Help — report metrics (eCPM): https://support.google.com/admanager/table/7568664
- Publisher ad ops practice for eCPM vs advertiser CPM — conceptual reference
- IAB/MRC impression measurement guidelines — conceptual reference
For learning only. Not advice on bids or spend.
You may also like
Metrics
Cost Per Mille (CPM)
CPM (Cost Per Mille) is the price an advertiser pays for 1,000 ad impressions.
CostMetrics
Fill Rate
Fill Rate measures the percentage of ad requests that result in a served ad.
SupplyMetrics
Revenue per Mille (RPM)
RPM (Revenue per Mille) measures how much a publisher earns per thousand page views or sessions.
RevenueMetrics
Frequency (Average Frequency)
Frequency measures how many times, on average, a unique user saw your ad during a campaign peri…
Delivery