Jul 17, 2026·8 min read
Viewability (Visible Impression Rate)
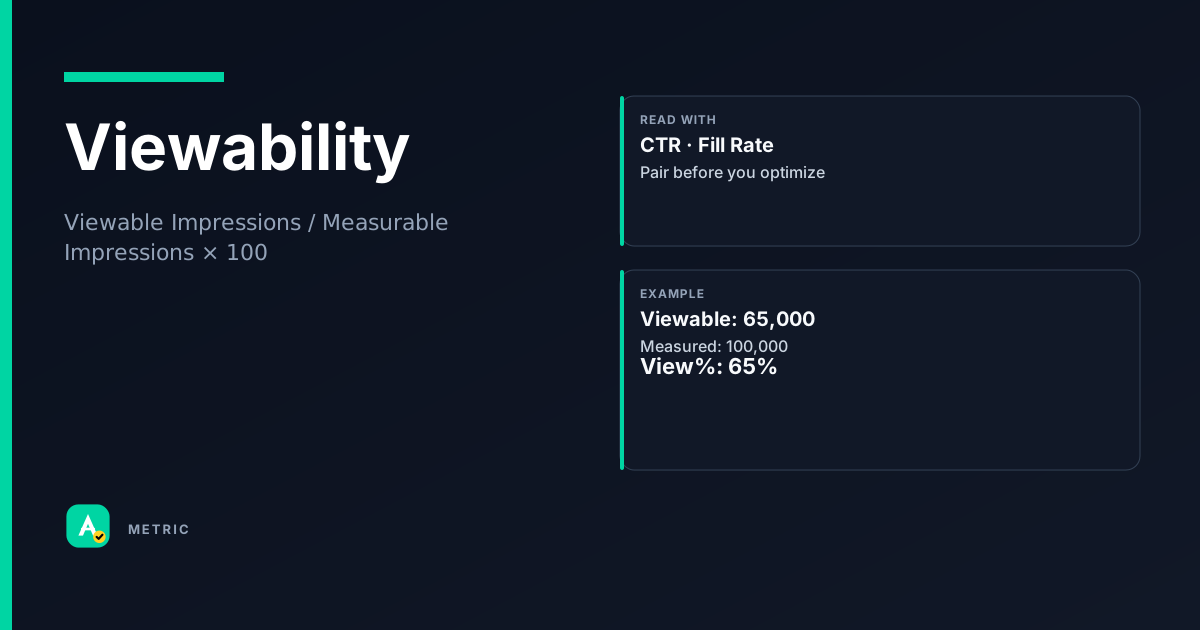
Viewability measures whether an ad had a reasonable chance of being seen by a human. It is the percentage of measured impressions that meet the MRC minimum thresholds for pixels-in-view and continuous time. A high viewability rate does not guarantee attention or action — it only confirms the ad was technically in-view. For the publisher, it is a yield signal; for the advertiser, it is a baseline quality filter.
What it is
Viewability is a quality gate, not a performance metric. It answers one question: Was the ad container visible on screen long enough for a human to register it?
The Media Rating Council (MRC) defines the minimum thresholds:
- Display ad: ≥50% of pixels in the viewport for ≥1 continuous second.
- Video ad: ≥50% of pixels in the viewport for ≥2 continuous seconds.
Platforms like Google follow these MRC minimums in Active View reporting. They report the viewability rate as % viewable on measurable impressions, and also break out the eligible vs. measurable gap — a critical nuance (see How to read it in a dashboard).
So what? Viewability is a hygiene metric. Without it, you cannot trust that your impression counts represent real opportunities to be seen. But chasing 100% viewability in isolation can inflate costs or shrink reach — it must be balanced with CTR, IVT rate, and cost efficiency.
How it is calculated
The core formula is straightforward, but the denominator has a critical caveat.
Viewability Rate = (Viewable Impressions / Measurable Impressions) × 100
Where:
- Viewable Impression: an impression that met the MRC threshold (≥50% pixels, ≥1s display / ≥2s video).
- Measurable Impression: an impression for which the platform could technically determine viewability (e.g., the ad tag supported measurement, the browser allowed it).
Important caveats
- Not all impressions are measurable. Some ad environments (e.g., certain mobile in-app webviews, legacy browsers) block measurement. The viewability rate only applies to the measurable subset.
- Eligible vs. measurable gap. Google Ad Manager reports eligible impressions (all served) and measurable impressions. A large gap means many impressions could not be measured — the reported viewability rate may not represent the full campaign.
- Counting method. Measurement is typically done via a JavaScript pixel that polls the DOM for position and visibility at intervals (e.g., every 50–100ms). The first continuous second (or two) that meets the threshold triggers a viewable count.
- GroupM / MRC floor. Many advertisers set a campaign floor of 70% viewable rate; some premium deals require 80%+.
How to read it in a dashboard
A single viewability number can mislead if you ignore the measurement gap. Here is how to read it step by step.
First, check the measurable rate. If only 60% of your impressions were measurable, the viewability rate on the remaining 40% may not represent the campaign. A high viewability rate on low measurability is a red flag — you are flying blind on a large chunk of delivery.
Second, compare viewability to the MRC floor. Most buyers target ≥70% viewable. Below that, you are paying for impressions that likely were never seen.
Third, pair viewability with complementary metrics:
- CTR: High viewability + low CTR may mean the ad was visible but not compelling (or the wrong audience).
- IVT rate: High viewability + high IVT could mean bots are gaming viewability checks.
- Cost per viewable impression (CPVI): The real cost of a seen impression. A high viewability rate at a low CPM may still be expensive if the CPVI is high.
Common dashboard misread: A publisher sees 85% viewability and celebrates. But the measurable rate is only 50% — half the inventory is unmeasured. The true viewability on all served impressions could be much lower. Always check the eligible/measurable split.
What usually moves this metric
Viewability is a function of ad placement, page layout, user behavior, and technical implementation. Here are the main levers.
Placement & page position
- Above the fold (viewport-visible on load) typically yields higher viewability than below the fold.
- Sticky / fixed units (e.g., sticky header, sticky sidebar) stay in view longer, often boosting viewability above 90%.
- In-content ads (e.g., mid-article) can have high viewability if the user scrolls past them, but may be missed if the user bounces.
Ad unit size
- Larger units (e.g., 300×250, 728×90) are easier to meet the 50% pixel threshold than small units (e.g., 120×60).
- Interscrollers and native ads that blend with content can have high viewability if they are in the natural reading flow.
Page load & rendering
- Lazy loading can delay ad rendering until the unit is near the viewport, improving viewability by avoiding off-screen impressions.
- Slow page load may cause the ad to render after the user has scrolled past it, reducing viewability.
- Header bidding wrappers that delay ad server response can cause the ad to load late, hurting viewability.
User behavior
- Scroll depth: Users who scroll deeper see more below-the-fold ads. High bounce rate pages will have low viewability on lower placements.
- Session duration: Longer sessions give more time for ads to become viewable.
Tradeoffs
- Chasing 100% viewability often means buying only premium, above-the-fold placements — which drives up CPMs and may limit reach. A 70–80% viewability target is often the sweet spot for cost efficiency.
- Sticky units can annoy users and increase bounce rate, hurting viewability on other placements. Measure UX impact alongside viewability.
- Lazy loading can improve viewability but may reduce fill rate if the ad request fires too late and the user leaves before the ad loads.
Formula
Denominator is measurable impressions, not total served impressions. Check the eligible/measurable gap in your platform (e.g., Google Ad Manager Active View).
Scenarios
The 95% viewability campaign that underperformed
A home-services advertiser ran a display campaign with 95% viewability but a CTR of 0.02% and zero conversions.
- What happened: The campaign used sticky footer units that stayed in view constantly. Users saw the ad but ignored it (banner blindness).
- Fix: Shifted to in-content native placements with 72% viewability but a CTR of 0.15% and positive conversion rate.
- Takeaway: High viewability does not guarantee engagement. Always pair with CTR or conversion data.
The publisher who hid low measurability
A publisher reported 80% viewability to buyers, but the measurable rate was only 45%.
- What happened: Most inventory was in a mobile web environment where the measurement SDK failed to fire. The 80% was only on the 45% that could be measured.
- Fix: The publisher updated their ad tags to a newer measurement library and saw measurable rate rise to 85%, with viewability dropping to 65% — a more honest picture.
- Takeaway: Always report viewability alongside measurable rate. A high viewability on low measurability is a red flag.
The video campaign that hit 90% viewability but high IVT
A video campaign on a programmatic exchange showed 90% viewability but a 15% IVT rate.
- What happened: Bots were simulating viewable impressions by keeping the video player in a hidden iframe that reported as in-view.
- Fix: The advertiser added IVT filtering and pre-bid exclusion lists for suspicious domains. Viewability dropped to 75%, but IVT dropped to 2% and real engagement improved.
- Takeaway: Viewability and IVT must be monitored together. High viewability + high IVT = likely fraud.
Common pitfalls
Viewability equals attention
A visible ad does not mean a user looked at it or processed it. Viewability is a necessary but insufficient condition for attention.
- What to do instead: Use attention metrics (e.g., hover time, eye-tracking proxies) or at minimum pair viewability with CTR and conversion data.
Optimizing viewability in isolation
Setting a 90% viewability floor in a DSP can limit supply to expensive, above-the-fold placements, inflating CPMs and reducing reach.
- What to do instead: Set a reasonable floor (e.g., 70%) and monitor cost per viewable impression (CPVI). Test higher floors only if the incremental cost is justified by performance.
Ignoring the measurable rate
A viewability rate of 85% sounds great, but if only 40% of impressions were measurable, the true viewability on all served impressions could be much lower.
- What to do instead: Always check the measurable rate. If it is below 70%, investigate why measurement is failing (ad tag issues, browser limitations, mobile web quirks).
Summary
Viewability is a baseline quality filter, not a performance goal. It confirms the ad had a chance to be seen, but does not guarantee attention, engagement, or conversion.
- Always read viewability alongside measurable rate, CTR, and IVT rate.
- Target 70–80% viewability for most campaigns; chasing 100% often inflates costs without proportional lift.
- For publishers, improving viewability (placement, lazy loading, page speed) can increase yield, but never at the expense of user experience.
Quick check
Confirm you understood this article.
boolean
A viewability rate of 90% means 90% of all served impressions were viewable.
Select an answer to continue
References
- MRC/IAB Viewable Ad Impression Guidelines — conceptual reference (https://www.iab.com/guidelines/mrc-viewable-impression-guidelines/)
- Google Ad Manager — Active View reporting — conceptual reference (https://support.google.com/admanager/answer/3154105)
- Google Ad Manager — How Active View metrics are calculated — conceptual reference (https://support.google.com/admanager/answer/6233478)
For learning only. Not advice on bids or spend.
You may also like
Metrics
Click-through rate (CTR)
Click-through rate (CTR) measures how often people click your ad after seeing it.
EngagementMetrics
Fill Rate
Fill Rate measures the percentage of ad requests that result in a served ad.
SupplyMetrics
Invalid Traffic Rate (IVT Rate)
IVT Rate measures the share of ad impressions flagged as invalid traffic — non-human or fraudul…
QualityMetrics
Auction Latency
Auction Latency measures the time from when a bid request is sent to when the auction decision…
Tech