Jul 17, 2026·8 min read
Invalid Traffic Rate (IVT Rate)
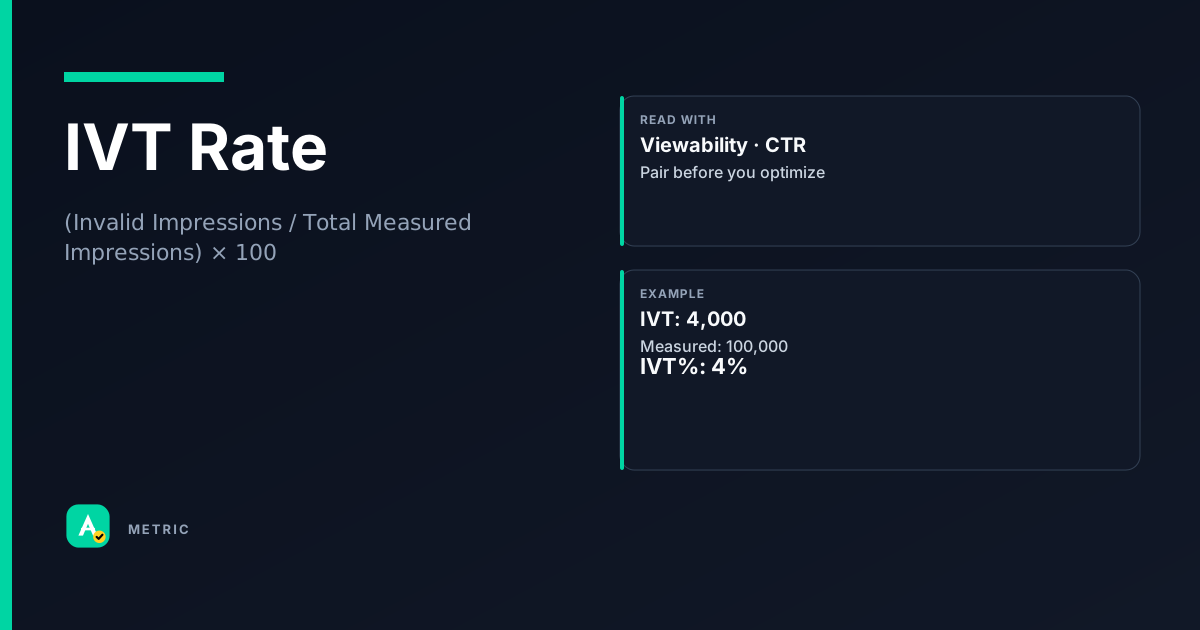
IVT Rate measures the share of ad impressions flagged as invalid traffic — non-human or fraudulent activity that should never be counted or paid for. For platforms, it is a core hygiene metric: a high IVT Rate erodes trust with both buyers and sellers, and can jeopardize measurement accreditation. Understanding the distinction between GIVT (general invalid traffic) and SIVT (sophisticated invalid traffic) is essential for interpreting the number correctly.
What IVT Rate is
IVT Rate is the percentage of total ad impressions that a measurement system identifies as invalid traffic — activity that does not represent a genuine human user. The Media Rating Council (MRC) splits invalid traffic into two tiers:
- GIVT (General Invalid Traffic): Bots, spiders, crawlers, pre-fetch, and other automated activity that can be detected through routine list-based or pattern-based methods.
- SIVT (Sophisticated Invalid Traffic): Fraudulent traffic that deliberately mimics human behavior — click farms, device hijacking, ad stacking, and other techniques designed to evade standard detection.
Most accredited measurement vendors filter GIVT automatically and apply additional techniques for SIVT. Google’s Active View, for example, notes that it filters GIVT and some SIVT methods as part of its MRC-accredited measurement.
So what? A platform that reports a low IVT Rate may still be passing SIVT through to buyers. Always check whether the rate covers only GIVT or both tiers.
How it is calculated
IVT Rate = (Invalid Impressions / Total Measured Impressions) × 100
Where:
- Invalid Impressions = impressions flagged as GIVT + SIVT by the measurement system.
- Total Measured Impressions = all impressions that entered the measurement pipeline (including those later filtered).
Important caveats
- Denominator matters. Some platforms report IVT Rate against all served impressions; others report against measured impressions (excluding unfilled or technical errors). Always confirm which base is used.
- Detection lag. SIVT detection often happens post-auction, sometimes days later. A real-time dashboard may show a lower IVT Rate than a reconciled report.
- Filtering vs. reporting. A platform that filters invalid traffic before counting impressions will report a lower IVT Rate than one that counts everything and then flags the invalid portion. Both approaches are valid — but they are not comparable.
- Thresholds vary. The MRC does not mandate a single acceptable IVT Rate; it requires that vendors disclose their methodology. Industry benchmarks differ by channel (e.g., display vs. video vs. CTV).
How to read it in a dashboard
A single IVT Rate number is nearly meaningless without context. The first question to ask: Is this pre-filter or post-filter?
- Pre-filter IVT Rate = share of all served impressions that were later flagged as invalid. This number will be higher and is useful for diagnosing supply quality.
- Post-filter IVT Rate = share of impressions that passed initial GIVT filtering but were later flagged (usually SIVT). This number should be very low — often below 1%.
What to pair it with
- Viewability (Viewability): A high viewability rate alongside a high IVT Rate may indicate that bots are generating viewable impressions — a red flag.
- CTR (CTR): Spikes in CTR with no corresponding conversion lift often correlate with click fraud (a form of SIVT).
- CPA (CPA): A sudden drop in CPA alongside rising IVT Rate suggests that invalid traffic is inflating conversion counts.
Easy mistake: Seeing a 0.2% IVT Rate and celebrating clean traffic — when the vendor only reports GIVT and the real SIVT rate is 3%. Always check the methodology note.
What usually moves this metric
IVT Rate is not a lever you pull directly — it is an outcome of supply quality, detection sophistication, and campaign configuration. The following levers affect it:
Supply-side levers
- Blocklists and inclusion lists. Tightening domain or app lists reduces exposure to known low-quality sources. Over-blocking can reduce scale but usually lowers IVT Rate.
- ads.txt / app-ads.txt. Platforms that enforce authorized digital sellers see fewer spoofed domains, which reduces SIVT.
- Sellers.json and SupplyChain. Transparency in the reselling chain helps platforms identify and exclude intermediaries that may introduce invalid traffic.
Detection-side levers
- Vendor selection. Not all measurement vendors detect SIVT equally. Upgrading to a vendor with stronger SIVT detection will increase the reported IVT Rate (because more invalid traffic is caught), even though actual traffic quality hasn’t changed.
- Threshold tuning. Some platforms let you set a minimum IVT Rate threshold for excluding placements. Lowering the threshold catches more fraud but may also exclude legitimate long-tail inventory.
Campaign-side levers
- Geo-targeting. Traffic from certain regions is associated with higher IVT rates. Narrowing geo-targets can reduce the rate.
- Device and OS filtering. Older operating systems and certain device models are disproportionately used in botnets. Excluding them may lower IVT Rate.
Tradeoffs
When you should NOT chase this metric: If you optimize for the lowest possible IVT Rate by over-blocking, you may exclude valuable, high-viewability inventory that happens to have a small amount of background bot traffic. The goal is not zero — it is acceptable and transparent IVT. A platform that reports 0.0% IVT Rate is likely filtering so aggressively that it is hiding real traffic quality issues.
Formula
Denominator varies by vendor — confirm whether it is served impressions or measured impressions.
Scenarios
The weekend bot spike
A DSP noticed that IVT Rate jumped from 0.4% to 2.1% every Saturday on a particular publisher’s mobile app.
What happened: A botnet was programmed to run on weekends, targeting rewarded video placements. What they did: The platform added the app to a manual review list, confirmed the pattern with its measurement vendor, and blocked the app until the publisher cleaned its traffic.
Takeaway: IVT Rate trends matter more than isolated levels. A recurring spike is a signature of automated fraud.
The vendor switch that made IVT Rate worse
A platform switched measurement vendors and saw its reported IVT Rate climb from 0.3% to 1.1%.
What happened: The new vendor detected SIVT that the previous vendor missed — specifically, device-fingerprint-based fraud. What they did: The platform updated its documentation to explain that the higher rate reflected better detection, not worse traffic.
Takeaway: A rising IVT Rate after a vendor change can be a sign of improved measurement, not degraded supply.
The CPA drop that wasn't real
A home-services advertiser saw CPA drop 40% in one week and assumed campaign optimization was working.
What happened: A fraudulent publisher was injecting conversion pixels on bot-driven impressions. The IVT Rate on that publisher was 8%, but the platform’s dashboard only showed the blended rate of 0.6%. What they did: The advertiser segmented IVT Rate by publisher, found the outlier, and blocked it. CPA returned to normal.
Takeaway: Blended IVT Rate hides bad actors. Always segment by domain or app.
Common pitfalls
Treating IVT Rate as a single, stable number
IVT Rate varies by channel, device, geography, and time of day. A blended rate of 0.5% may mask a 5% rate on CTV and 0.1% on mobile web.
What to do instead: Segment IVT Rate by at least: device type, geo, and publisher. Monitor trends, not just levels.
Assuming a 0% IVT Rate means clean traffic
No detection system catches all invalid traffic. A 0% rate usually means the vendor is filtering aggressively before reporting, or is not detecting SIVT at all.
What to do instead: Ask your vendor for the methodology — specifically, whether the rate includes SIVT and what the detection latency is.
Optimizing campaigns to minimize IVT Rate
If you set a hard cap (e.g., block any placement with >1% IVT Rate), you may exclude legitimate inventory that has a small amount of background bot traffic — especially on long-tail sites with low overall volume.
What to do instead: Use IVT Rate as a diagnostic, not a KPI. Pair it with viewability and conversion data to decide whether to block.
Summary
IVT Rate is a hygiene metric, not a performance metric. A low rate is necessary but not sufficient for campaign quality. The real value comes from understanding what kind of invalid traffic is being caught, and whether the rate is consistent across segments.
- Always confirm whether the reported rate includes SIVT or only GIVT.
- Segment by publisher, device, and geo to surface hidden problems.
- Don’t optimize for zero — optimize for transparency and acceptable levels given your risk tolerance.
Quick check
Confirm you understood this article.
boolean
IVT Rate includes both GIVT and SIVT in all measurement vendor reports.
Select an answer to continue
Related metrics
References
- MRC Invalid Traffic Detection and Filtration Guidelines Addendum — conceptual reference for GIVT/SIVT definitions and filtration standards.
- Google Ad Manager Active View / MRC accreditation notes (https://support.google.com/admanager/table/7568664) — conceptual reference for how a major platform reports IVT filtration.
- IAB Tech Lab ads.txt / sellers.json specifications — conceptual reference for supply-chain transparency as an IVT mitigation lever.
For learning only. Not advice on bids or spend.
You may also like
Metrics
Cost Per Acquisition (CPA)
Cost Per Acquisition (CPA) measures the total advertising cost divided by the number of convers…
CostMetrics
Click-through rate (CTR)
Click-through rate (CTR) measures how often people click your ad after seeing it.
EngagementMetrics
Viewability (Visible Impression Rate)
Viewability measures whether an ad had a reasonable chance of being seen by a human.
QualityMetrics
Quality Score (QS)
Quality Score is Google Ads’ 1–10 diagnostic for keyword-level expected CTR, ad relevance, and…
Auction