Jul 17, 2026·7 min read
Return on Investment (ROI)
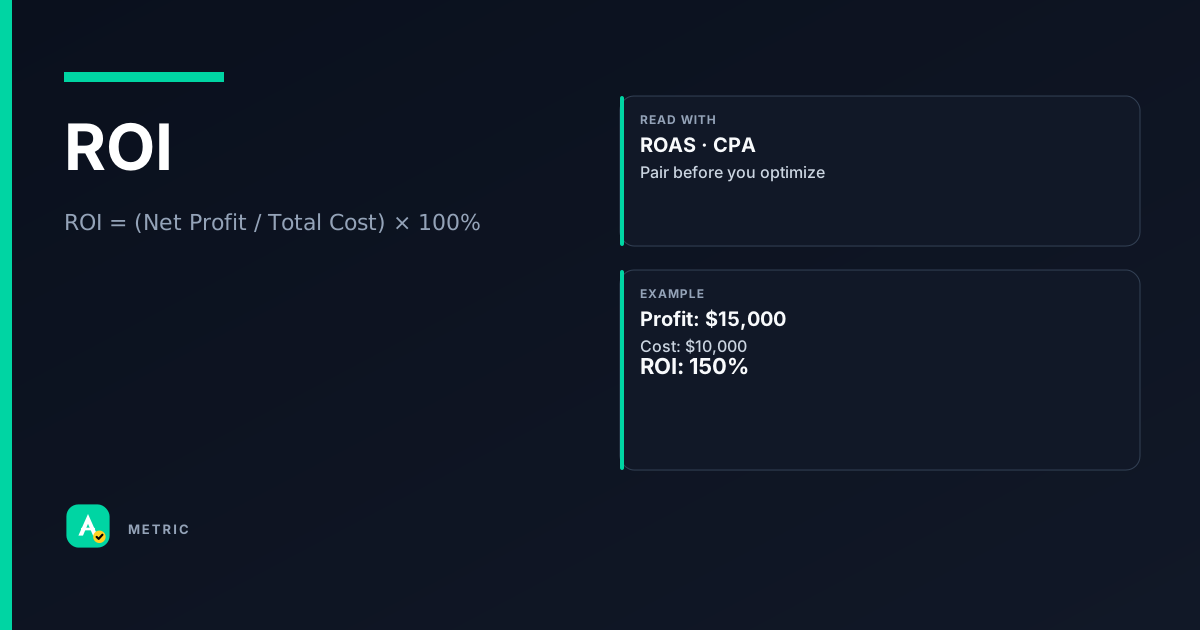
Return on Investment (ROI) measures the net profit generated by an advertising campaign relative to its total cost. Unlike ROAS, which only compares gross revenue to ad spend, ROI accounts for the cost of goods sold (COGS) and other operational expenses. This makes ROI the truer measure of business profitability from ad spend.
What it is
ROI is a financial metric that tells you whether your advertising dollars actually made money after all costs are subtracted. It answers the question: For every dollar I spent, how many dollars of profit did I earn?
A common mistake is treating ROI and ROAS as interchangeable. They are not. ROAS is a revenue-only ratio (revenue / ad spend). ROI is a profit ratio (net return / total cost). If you report ROI but omit COGS, fulfillment, or overhead, you are overstating performance — sometimes dramatically.
When ROI matters most
- Long decision horizon campaigns (e.g., subscription services, high-ticket items) where customer lifetime value (LTV) and retention costs dominate.
- Multi-channel attribution where you need to compare profitability across channels with different cost structures.
- Budget allocation decisions between brand-building and direct response.
So what: ROI is the metric executives and CFOs care about. If you only optimize for ROAS, you risk spending money on products with thin margins that look good on revenue but lose money on profit.
How it is calculated
The standard ROI formula from finance, adapted for advertising:
ROI = (Net Profit / Total Cost) × 100%
Where:
- Net Profit = Revenue from ad-driven conversions − (Ad Spend + COGS + Fulfillment + Overhead)
- Total Cost = Ad Spend + COGS + Fulfillment + Overhead
Platform caveats
- Google Ads does not report ROI directly. Their "ROAS" column is revenue / ad spend. To get ROI, you must upload conversion value that already subtracts COGS, or calculate offline.
- Meta Ads offers "Return on Ad Spend" (revenue / spend) but not ROI. You need to pull cost data from your ERP or CRM.
- Programmatic DSPs (e.g., DV360, Amazon DSP) report revenue-based ROAS. True ROI requires a post-bid analysis layer.
Example
A campaign generates $10,000 in revenue. Ad spend is $2,000. COGS is $4,000. Fulfillment is $1,000.
- ROAS = $10,000 / $2,000 = 5.0 (or 500%)
- Net Profit = $10,000 − ($2,000 + $4,000 + $1,000) = $3,000
- Total Cost = $2,000 + $4,000 + $1,000 = $7,000
- ROI = ($3,000 / $7,000) × 100% = 42.9%
So what: A 5x ROAS sounds great, but the true ROI is under 50%. Always calculate ROI when evaluating campaign profitability.
How to read it in a dashboard
A positive ROI means the campaign generated more profit than it cost. A negative ROI means you lost money. Zero ROI means you broke even.
What to pair it with
- ROAS — to see the revenue efficiency separate from cost structure.
- CPA (Cost Per Acquisition) — to understand unit cost of each customer.
- LTV (Lifetime Value) — to judge whether the upfront profit (or loss) is justified by future revenue.
Common dashboard misread
A home-services advertiser saw ROI of 150% and scaled spend. But they had excluded call-center handling costs. After including those, ROI dropped to 20%. The dashboard was showing partial profit, not total profit.
So what: Always verify which costs are included in your ROI calculation. If the dashboard says "ROI" but only subtracts ad spend, it is actually ROAS. Demand a full-cost view.
What usually moves this metric
Levers that improve ROI
Revenue side
- Increase average order value (AOV) via upsells or bundles.
- Improve conversion rate (CVR) to get more revenue from the same traffic.
- Target higher-intent audiences to reduce wasted spend.
Cost side
- Reduce COGS through supplier negotiation or product mix.
- Lower fulfillment costs (shipping, packaging, returns).
- Cut overhead allocated to the campaign (e.g., creative production, landing page hosting).
Ad spend efficiency
- Lower CPA by optimizing bidding, creative, and targeting.
- Reduce wasted impressions with better frequency capping and audience exclusions.
Tradeoffs
- Lowering CPA too aggressively can shrink reach and volume, reducing total profit even if ROI looks good.
- Increasing AOV may reduce conversion rate if the higher price point scares off price-sensitive buyers.
- Cutting COGS might degrade product quality, hurting LTV and returns.
So what: ROI optimization is a balancing act. Do not chase a high ROI number at the expense of scale or customer satisfaction. A 50% ROI on $1M profit is better than 200% ROI on $10K profit.
Formula
Net Profit = Revenue − (Ad Spend + COGS + Fulfillment + Overhead). Most ad platforms do not calculate ROI automatically; you must supply cost data.
Scenarios
The ROAS trap
A DTC brand reported 8x ROAS on Facebook Ads and scaled spend to $100K/month. After including COGS (60% of revenue) and shipping ($5/order), ROI was only 15%.
- What happened: They optimized for ROAS, ignoring product costs.
- What they did: Switched to ROI-based reporting, reduced spend on low-margin products, and focused on bundles with higher margins.
- Takeaway: ROAS is a vanity metric if you don't know your margins.
Long-tail LTV saves the campaign
A SaaS company's first-purchase ROI was −30% (they spent more to acquire than the first month's subscription).
- What happened: Short-term ROI looked terrible.
- What they did: Calculated ROI including 12-month LTV ($600 vs $50 first month). True ROI became 180%.
- Takeaway: For subscription models, always include LTV in your ROI calculation.
The hidden overhead mistake
An agency reported 300% ROI for a client's Google Ads campaign. The client's CFO asked about creative production costs ($15K) and landing page development ($10K).
- What happened: The agency only included ad spend in total cost.
- What they did: Recalculated with all campaign costs. ROI dropped to 80%.
- Takeaway: Include all attributable costs — creative, tech, and labor — for a true ROI picture.
Common pitfalls
Confusing ROI with ROAS
ROI and ROAS are not the same. ROAS = revenue / ad spend. ROI = (net profit) / (total cost). If you report ROAS as ROI, you are inflating performance.
- What to do instead: Always label your metric correctly. If you cannot include COGS, call it ROAS.
Ignoring time horizon
A campaign may show negative ROI in the first 30 days but positive ROI over 12 months (e.g., subscription services, high-consideration purchases).
- What to do instead: Set the ROI window to match your customer's purchase cycle or use LTV-adjusted ROI.
Excluding all costs
Many advertisers only include ad spend in total cost. This ignores COGS, fulfillment, returns, and overhead.
- What to do instead: Build a cost waterfall: ad spend → COGS → fulfillment → returns → overhead → total cost.
Summary
ROI is the ultimate measure of advertising profitability, but only if you include all costs.
- Always distinguish ROI from ROAS in reporting.
- Include COGS, fulfillment, and overhead in total cost.
- For long-cycle businesses, extend the ROI window to match LTV.
Quick check
Confirm you understood this article.
boolean
ROI and ROAS are the same metric.
Select an answer to continue
References
- Standard finance definition of ROI vs advertising ROAS (performance marketing teaching distinction)
- Google Ads Help glossary — ROAS definition (conceptual reference)
- IAB measurement guidelines — conceptual reference for cost inclusion in ROI
For learning only. Not advice on bids or spend.
You may also like
Metrics
Cost Per Acquisition (CPA)
Cost Per Acquisition (CPA) measures the total advertising cost divided by the number of convers…
CostMetrics
Lifetime Value (LTV)
Lifetime Value (LTV) estimates the total net revenue a single customer (or cohort) will generat…
ValueMetrics
Return on Ad Spend (ROAS)
Return on Ad Spend (ROAS) measures the revenue generated for every dollar spent on advertising.
PerformanceMetrics
Frequency (Average Frequency)
Frequency measures how many times, on average, a unique user saw your ad during a campaign peri…
Delivery