Jul 17, 2026·8 min read
Return on Ad Spend (ROAS)
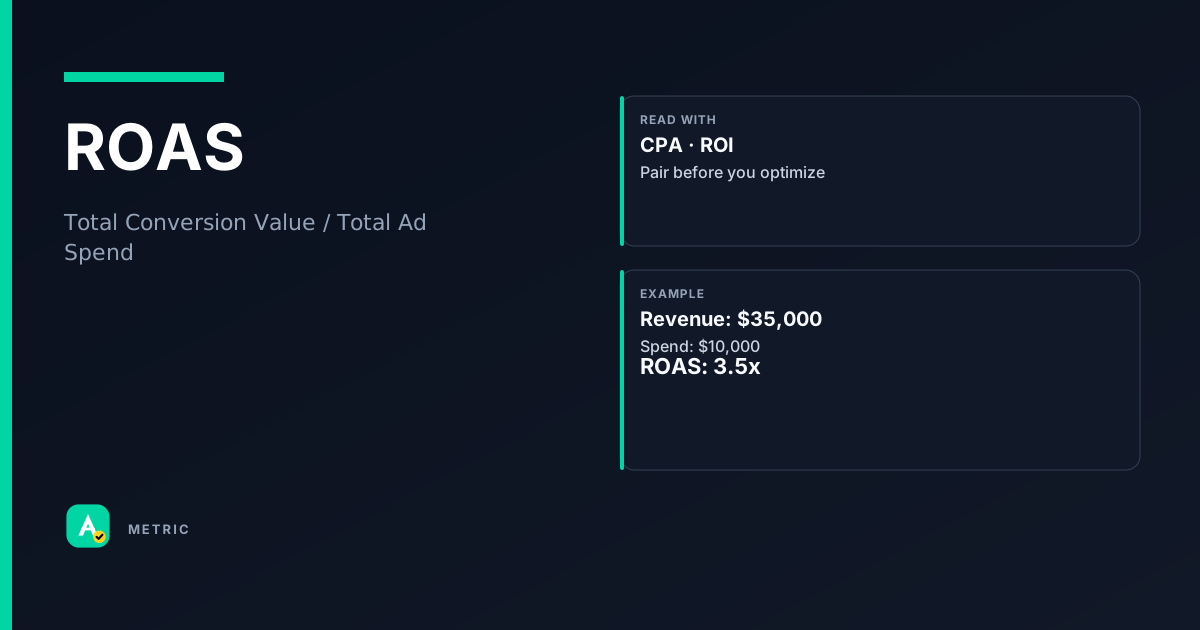
Return on Ad Spend (ROAS) measures the revenue generated for every dollar spent on advertising. It is the advertiser’s primary efficiency ratio: total conversion value divided by total spend. ROAS answers “did this campaign pay for itself?” but says nothing about profit margins or customer lifetime value — it is a top-deck metric that needs CPA and ROI as companions.
What ROAS is and why it matters
ROAS is the ratio of conversion value to ad cost. A 5:1 ROAS means every $1 in spend returned $5 in attributed revenue. Most platforms (Google Ads, Meta Ads Manager) display it as a ratio or percentage.
The metric is only as good as the attribution model behind it. Last-click ROAS credits the final touchpoint with all value, which can make upper-funnel campaigns look weak even when they drive awareness that later converts. Data-driven attribution or linear models distribute value across the path, giving a more honest picture.
Common use cases
- Campaign-level budget allocation — shift spend toward channels with higher ROAS
- Bid strategy targets — tROAS (target ROAS) bidding in Google Ads
- Creative testing — compare ROAS of ad variants to find the most efficient message
So what: ROAS is a directional efficiency signal, not a profit statement. Always pair it with margin data and LTV before making budget decisions.
How it is calculated
ROAS = Total Conversion Value / Total Ad Spend
Conversion value is the sum of all revenue (or assigned values) from conversions attributed to the campaign. Ad spend includes all costs: bids, platform fees, and any management overhead if you track it that way.
Critical caveats
- Attribution window — A 7-day click window will show higher ROAS than a 1-day click window. Always compare campaigns using the same window.
- Conversion value inclusion — Some platforms let you include only purchase revenue; others include lead values, add-to-carts, or custom events. Mixing value types inflates ROAS.
- Cross-device and offline — If your platform does not stitch cross-device journeys or import offline conversions, ROAS will be understated.
- View-through conversions — Including view-through conversions (impressions without clicks) can boost ROAS but may overcount casual exposure.
Check your platform’s definition: Google Ads Help — Glossary (ROAS) and Meta’s attribution documentation for window caveats.
How to read it in a dashboard
A single ROAS number is meaningless without context. A 3:1 ROAS might be excellent for a low-margin retailer or terrible for a SaaS business with high LTV.
What to pair with ROAS
- CPA — ROAS tells you revenue per dollar; CPA tells you cost per action. Together they reveal if you are spending efficiently to acquire valuable customers.
- Profit margin — A campaign with 10:1 ROAS on 5% margin is worse than a campaign with 4:1 ROAS on 40% margin. ROAS ignores cost of goods sold.
- LTV — If ROAS is 2:1 but customers have a 12-month LTV of $600, the campaign is likely profitable over time. Short-window ROAS misses this.
Dashboard trap
A common mistake is sorting campaigns by ROAS and pausing the lowest ones. That works only if ROAS is stable and attribution is accurate. A home-services advertiser once paused a “low ROAS” display campaign, only to see their branded search ROAS drop 40% — the display campaign was driving awareness that later converted via search. Never optimize ROAS in isolation.
What usually moves this metric
Levers that increase ROAS
- Bid strategy — Switch to tROAS (target ROAS) bidding in Google Ads. The algorithm optimizes for your target ratio, but it needs enough conversion data (usually 30+ conversions in 30 days).
- Audience refinement — Narrow targeting to high-intent segments (remarketing, customer match, in-market). Higher conversion rates lift ROAS.
- Creative and offer — Stronger calls-to-action, better landing page experience, or a limited-time discount can increase conversion value without raising spend.
- Attribution model — Moving from last-click to data-driven attribution often redistributes value to upper-funnel touchpoints, raising their reported ROAS.
Levers that can decrease ROAS (but may be correct)
- Expanding to new audiences — Prospecting campaigns usually have lower ROAS than remarketing. That is fine if they feed the funnel.
- Increasing budget — At higher spend levels, you reach less efficient inventory. ROAS may drop, but absolute revenue may grow.
Tradeoffs
Optimizing ROAS alone can lead to under-investment in upper-funnel channels and over-reliance on remarketing. A remarketing campaign might show 10:1 ROAS while a prospecting campaign shows 2:1 — but without prospecting, the remarketing pool dries up. Balance ROAS optimization with reach and frequency goals.
When you should NOT chase this metric: If your business goal is brand awareness or new customer acquisition, ROAS is the wrong north star. Use reach, frequency, and CPA instead.
Formula
Platforms differ on what counts as conversion value (e.g., purchase revenue only vs. all assigned values). Always verify in your platform’s glossary.
Scenarios
The last-click trap
Setup: A DTC brand runs YouTube awareness ads and Google Search retargeting. Search shows 6:1 ROAS; YouTube shows 1.5:1. The brand pauses YouTube.
- What happened: Branded search ROAS dropped to 2:1 within two weeks. YouTube was driving top-of-funnel awareness that later converted via search.
- What they did: Re-enabled YouTube, switched to data-driven attribution, and measured blended ROAS (3.5:1). Takeaway: Never kill a channel based on last-click ROAS alone. Use a model that credits the full path.
The margin blind spot
Setup: An e-commerce retailer sees Campaign A at 8:1 ROAS and Campaign B at 3:1 ROAS. They shift 80% of budget to A.
- What happened: Campaign A promotes low-margin accessories (10% margin); Campaign B sells high-margin furniture (50% margin). Profit from B was higher despite lower ROAS.
- What they did: Added a profit column to the dashboard and rebalanced budget based on profit per dollar spent. Takeaway: ROAS ignores cost of goods sold. Always layer in margin before making budget decisions.
The attribution window mismatch
Setup: A SaaS company compares monthly ROAS across channels using the platform default (7-day click).
- What happened: LinkedIn ads showed 2:1 ROAS; Google Search showed 5:1. The team cut LinkedIn.
- What they did: Changed both to 28-day click + 1-day view attribution. LinkedIn ROAS jumped to 4:1 because B2B buyers research for weeks before converting. Takeaway: Match the attribution window to your sales cycle. A short window penalizes channels with longer consideration phases.
Common pitfalls
Treating ROAS as profit
ROAS is revenue / spend, not profit / spend. A 5:1 ROAS with 80% COGS yields only 1:1 profit. What to do instead: Calculate profit ROAS = (revenue × margin) / spend, or track ROI separately.
Comparing ROAS across different attribution models
A last-click ROAS of 4:1 and a data-driven ROAS of 3:1 are not comparable. What to do instead: Standardize attribution model and window across all campaigns before ranking.
Optimizing for ROAS in a growth phase
High ROAS often comes from remarketing to existing customers. If you need new customers, accept lower ROAS on prospecting. What to do instead: Set separate ROAS targets by funnel stage (e.g., 2:1 for prospecting, 6:1 for remarketing).
Summary
ROAS is a powerful efficiency metric, but it is incomplete without margin, attribution context, and funnel stage awareness.
- Always note the attribution window and model when reporting ROAS.
- Pair ROAS with CPA, margin, and LTV to get the full picture.
- Do not optimize ROAS in isolation — it can hide profitable upper-funnel investment.
Quick check
Confirm you understood this article.
single
What does ROAS stand for?
Select an answer to continue
References
- Google Ads Help — Glossary (ROAS): https://support.google.com/google-ads/answer/12851704
- Meta Ads Manager — Attribution documentation (window caveats)
- IAB / MRC — Measurement guidelines for conversion attribution
For learning only. Not advice on bids or spend.
You may also like
Metrics
Cost Per Acquisition (CPA)
Cost Per Acquisition (CPA) measures the total advertising cost divided by the number of convers…
CostMetrics
Lifetime Value (LTV)
Lifetime Value (LTV) estimates the total net revenue a single customer (or cohort) will generat…
ValueMetrics
Return on Investment (ROI)
Return on Investment (ROI) measures the net profit generated by an advertising campaign relativ…
PerformanceMetrics
Quality Score (QS)
Quality Score is Google Ads’ 1–10 diagnostic for keyword-level expected CTR, ad relevance, and…
Auction