Jul 17, 2026·7 min read
Quality Score (QS)
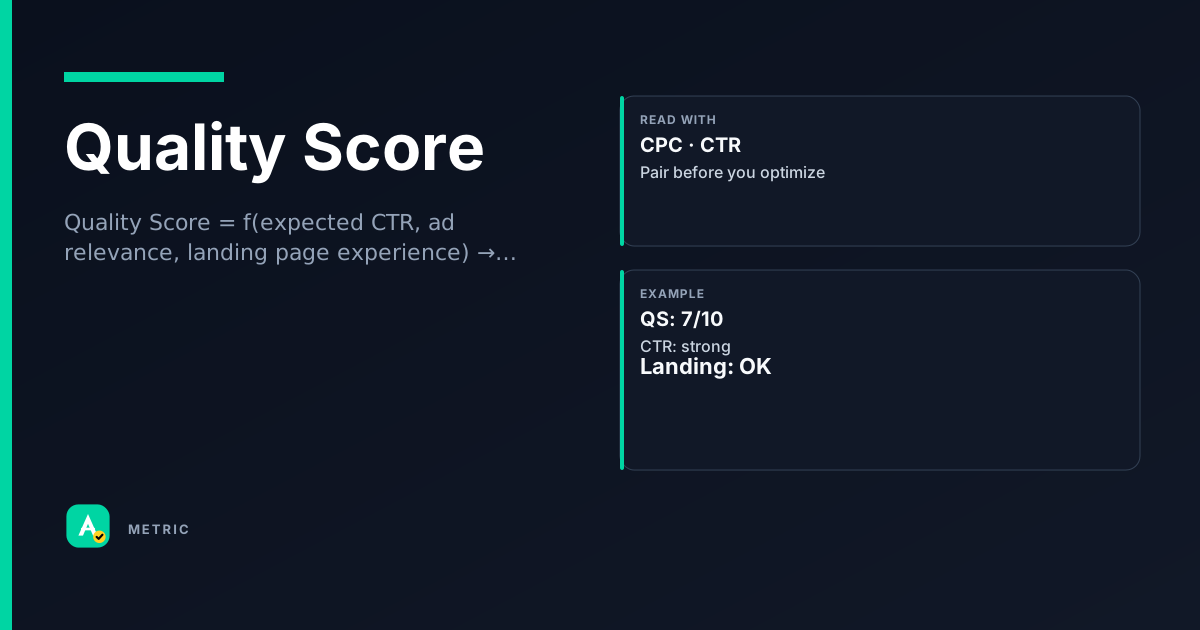
Quality Score is Google Ads’ 1–10 diagnostic for keyword-level expected CTR, ad relevance, and landing page experience. It is not a direct bid modifier — it helps you find weak spots in your ad-auction setup. A higher QS can lower your effective CPC and improve ad position, but chasing the number alone misses the point.
What it is
Quality Score is Google’s estimate of how relevant your keyword, ad, and landing page are to a searcher. It is a 1–10 rating, where 10 means “excellent” and 1 means “fix this.”
Three components drive the score:
- Expected CTR — how likely your ad is to be clicked when shown for that keyword.
- Ad relevance — how closely your ad text matches the keyword’s intent.
- Landing page experience — whether the page is useful, fast, and relevant to the query.
Quality Score is a diagnostic, not a KPI. Google explicitly says it is meant to surface improvement opportunities, not to be optimized in isolation. A 10 does not guarantee a win; a 5 does not mean you should pause the keyword.
How it is calculated
Google does not publish a raw formula. Quality Score is a relative measure: your keyword’s expected performance compared to other advertisers targeting the same query.
What we know from Google Ads Help
- The score is updated in real time based on the most recent auction data.
- Each component (expected CTR, ad relevance, landing page experience) is rated as Above average, Average, or Below average.
- The 1–10 number is a weighted combination of those ratings, but the weights are opaque.
Important caveats
- Quality Score is keyword-level, not campaign- or ad-group-level.
- It can differ by device, location, and time of day — the score you see in the UI is a historical aggregate.
- A score of 10 does not mean “perfect”; it means “better than most competitors for this query.”
How to read it in a dashboard
In Google Ads, Quality Score appears as a column next to each keyword. The number alone is not actionable — you need the component statuses (the colored dots or text ratings).
What to look for
- Score ≤ 5 — at least one component is likely “Below average.” Click the status icon to see which one.
- Score 6–7 — average. Look for “Below average” on any component and fix that first.
- Score 8–10 — strong. Do not relax; monitor for drift after landing page or ad copy changes.
Pair Quality Score with
What usually moves this metric
Expected CTR levers
- Write ad copy that includes the keyword or its close variants.
- Use responsive search ads with multiple headlines and descriptions.
- Test call-to-action phrasing that matches search intent (informational vs. transactional).
Ad relevance levers
- Group keywords into tightly themed ad groups (one product or service per group).
- Use exact match and phrase match to avoid serving ads for loosely related queries.
- Include the keyword in the headline when possible.
Landing page experience levers
- Ensure the page loads in under 3 seconds on mobile.
- Match the page content to the ad promise (if the ad says “20% off,” the page should show that offer immediately).
- Remove intrusive interstitials and pop-ups that block content.
Tradeoffs
Optimizing for Quality Score alone can backfire. A common mistake: stuffing keywords into ad copy until it reads unnaturally, which hurts CTR. Another: over-narrowing keyword match types to boost relevance while losing volume. Balance QS improvements with reach and conversion goals.
Formula
Google does not disclose exact weights. The score is relative to other advertisers for the same query.
Scenarios
The keyword that dropped from 8 to 4 overnight
A home-services advertiser saw Quality Score fall from 8 to 4 on their “emergency plumber” keyword. What happened: They had changed the landing page to a general service directory instead of the emergency booking form. Fix: Reverted the landing page to the dedicated emergency page. Score returned to 7 within 48 hours. Takeaway: Landing page experience is the fastest lever to break — or fix — Quality Score.
The 10 that cost more than the 6
An e-commerce brand had a keyword with QS 10 and a CPC of $0.50, while a different keyword with QS 6 had a CPC of $0.45. What happened: The QS 10 keyword had high expected CTR but low conversion rate; the QS 6 keyword converted twice as often. What they did: They stopped optimizing for QS and focused on ROAS. Takeaway: Quality Score is a diagnostic, not a profit target. A lower QS keyword can still be your best performer.
The ad group that was too broad
A SaaS company put “project management software,” “team task tracker,” and “agile tool” into one ad group. What happened: Ad relevance was “Below average” for all three keywords because one ad could not match all intents. Fix: Split into three ad groups with dedicated ads. QS rose from 5 to 8 on each keyword. Takeaway: Tight ad groups improve ad relevance and expected CTR simultaneously.
Common pitfalls
Treating Quality Score as a primary KPI
Quality Score is a diagnostic — Google says so explicitly. If you optimize for a higher number without considering conversions, you may harm campaign performance.
- Do instead: Use QS to find weak components, then fix those components with conversion impact in mind.
Obsessing over a 10
A perfect 10 does not mean your campaign is perfect. It means your expected CTR, ad relevance, and landing page are better than most competitors for that query. You could still have a terrible conversion rate.
- Do instead: Pair QS with conversion data. If a 10 keyword does not convert, the problem is likely on the landing page or offer — not the ad.
Ignoring component-level data
Looking only at the 1–10 number is like seeing a fever without knowing the infection. The component statuses tell you why the score is low.
- Do instead: Click the status icon in Google Ads to see which component is “Below average” and fix that first.
Summary
Quality Score is a diagnostic tool, not a campaign goal. Use it to identify weak spots in keyword-ad-page alignment, then fix those spots with conversion impact in mind.
- Focus on component statuses (expected CTR, ad relevance, landing page experience), not the 1–10 number alone.
- Pair QS with CTR, CPC, and CVR to decide what to optimize.
- Never pause a profitable keyword just because its QS is low — the auction outcome depends on more than QS.
Quick check
Confirm you understood this article.
single
Quality Score is a 1–10 rating that is best described as:
Select an answer to continue
References
- Google Ads Help — About Quality Score (conceptual reference)
- Google Ads Help — Monitor ads and keywords (conceptual reference)
- Google Ads Help — Ad Rank and Quality Score (conceptual reference)
For learning only. Not advice on bids or spend.
You may also like
Metrics
Cost per click (CPC)
Cost per click (CPC) measures the average price an advertiser pays each time someone clicks the…
CostMetrics
Click-through rate (CTR)
Click-through rate (CTR) measures how often people click your ad after seeing it.
EngagementMetrics
Conversion Rate (CVR)
Conversion rate (CVR) measures how often a click (or visit) leads to a desired action — a purch…
PerformanceMetrics
Cost Per Acquisition (CPA)
Cost Per Acquisition (CPA) measures the total advertising cost divided by the number of convers…
Cost