Jul 17, 2026·8 min read
Conversion Rate (CVR)
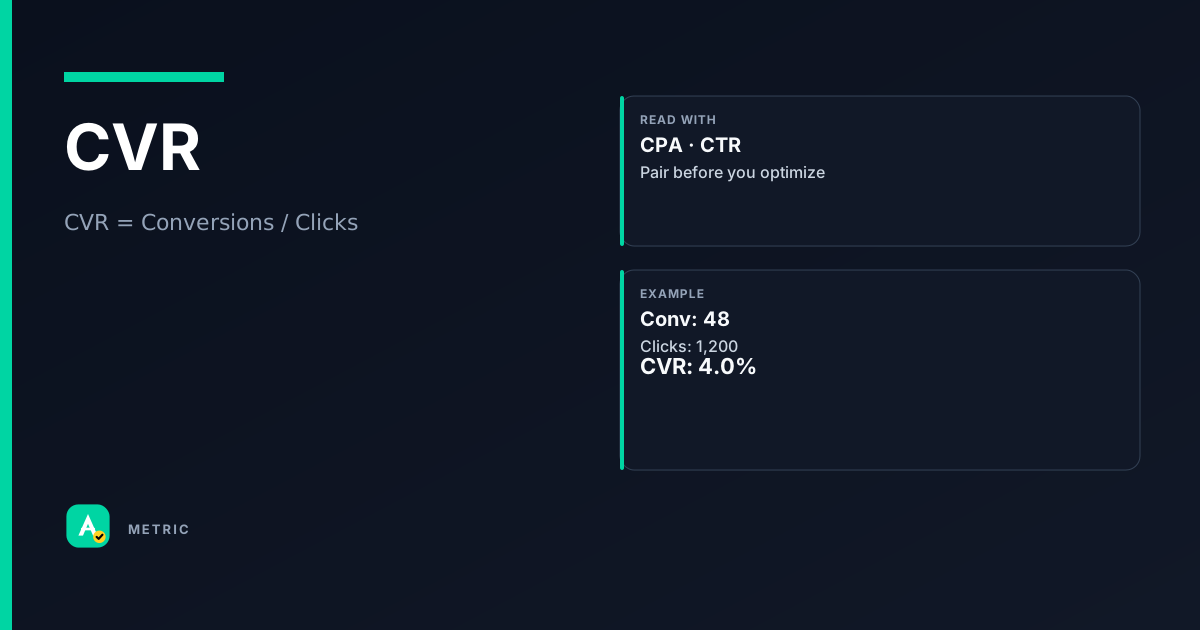
Conversion rate (CVR) measures how often a click (or visit) leads to a desired action — a purchase, sign-up, download, or lead. It is the bridge between ad engagement and business outcome. Unlike CTR, which tells you about creative appeal, CVR tells you about landing page relevance, offer strength, and checkout friction. Always check the denominator: clicks vs. sessions vs. impressions.
What it is
CVR is the percentage of interactions that result in a predefined conversion event. It is the closest thing to a “quality of traffic” signal in a performance dashboard.
A high CVR means the people arriving at your landing page are well-targeted, the page loads fast, the offer is compelling, and the conversion flow is frictionless. A low CVR — while clicks are high — usually points to a mismatch between the ad promise and the post-click experience.
Common funnel stages for CVR
- Post-click CVR — conversions / clicks. The standard for most paid search and social campaigns.
- Post-view CVR — conversions / impressions (rarely used alone; prone to attribution noise).
- Session CVR — conversions / sessions. Used in analytics tools like Google Analytics when click data is unavailable.
So what: If you only optimize for CTR, you can drive cheap clicks that never convert. CVR is the reality check.
How it is calculated
CVR = Conversions / Clicks
Example: 50 conversions from 1,000 clicks → 50 / 1000 = 0.05 = 5% CVR.
Critical caveats
- Denominator choice matters. Google Ads reports post-click CVR by default. Google Analytics reports session-based CVR. These numbers can differ by 10–30% for the same campaign.
- Conversion window. A 30-day click-through window will yield higher CVR than a 7-day window. Always compare apples to apples.
- Cross-device. If a user clicks on mobile and converts on desktop, the conversion may or may not be attributed depending on your measurement setup.
- View-through conversions. Adding view-through conversions inflates CVR and muddies the signal. Use post-click CVR for landing page diagnosis.
How to read it in a dashboard
A single CVR number is meaningless without context. Read it alongside CPA and ROAS to understand efficiency, and alongside CTR to catch mismatches.
Common dashboard patterns
- High CTR + Low CVR — The ad is compelling, but the landing page or offer disappoints. Classic “bait and switch” feel. Fix: align ad copy with page content.
- Low CTR + High CVR — Niche, highly relevant traffic. The ad may be under-scaled. Consider expanding targeting or testing new creative.
- Both low — Targeting or creative is off. Revisit audience and ad relevance.
- Both high — Healthy funnel. Scale budget carefully; watch for CPA creep.
What to pair it with
- CPA — CVR × CPA = cost per click (roughly). If CVR drops, CPA rises.
- Bounce rate — A high bounce rate usually precedes a low CVR.
- Average order value (AOV) — A high CVR on low-value orders may be less profitable than a lower CVR on high-value orders.
What usually moves this metric
CVR is a systems metric — it responds to changes in targeting, creative, landing page, and offer. Isolated changes rarely work; you need to treat the funnel as a connected system.
Targeting & audience
- Narrowing — More specific audiences (e.g., remarketing vs. prospecting) almost always lift CVR.
- Intent signals — Keyword match type, in-market audiences, custom intent. Higher intent = higher CVR.
- Device & time — Mobile CVR is often lower than desktop for complex purchases. Late-night traffic may convert differently.
Landing page & experience
- Load speed — Every 100ms improvement can lift CVR measurably.
- Message match — The headline and CTA on the landing page should mirror the ad that brought the user.
- Form length — Fewer fields = higher CVR. Test ruthlessly.
- Trust signals — Reviews, security badges, return policy.
Offer & pricing
- Discounts & urgency — Limited-time offers, free shipping, and guarantees lift CVR.
- Payment options — More payment methods (BNPL, digital wallets) reduce checkout abandonment.
Tradeoffs
- CVR vs. volume. Narrow targeting lifts CVR but caps reach. You may need to accept a lower CVR to hit revenue goals.
- CVR vs. AOV. A “buy one get one” offer may boost CVR but slash average order value. Measure profit, not just conversion rate.
- CVR vs. CPA. A high CVR can coexist with a high CPA if the cost per click is high. Optimize for the ratio that matters to your margin.
Formula
Platforms differ: Google Ads uses clicks; Google Analytics uses sessions. Check your source-of-truth definition.
Scenarios
The remarketing trap
Setup: A home-services advertiser runs a remarketing campaign and sees CVR of 12% — triple the prospecting campaign. They shift 80% of budget to remarketing.
- What happened: Remarketing captures warm users who already know the brand. The high CVR was real but the audience pool was small. Within two weeks, frequency spiked, CVR dropped to 4%, and CPA doubled.
- What they did: Re-balanced to 60% prospecting / 40% remarketing and set frequency caps.
- Takeaway: A high CVR on a small, saturated audience is a mirage. Always check reach and frequency alongside CVR.
The landing page mismatch
Setup: A DTC brand runs a Facebook campaign for “30% off winter jackets.” CTR is strong at 3.5%, but CVR is 0.8%.
- What happened: The ad promised a discount on jackets. The landing page showed the full collection at full price — the discount code was buried in a banner. Users bounced.
- What they did: Built a dedicated landing page with the discount hero, the same jacket images from the ad, and a one-click checkout.
- Result: CVR rose to 3.1%. Takeaway: Message match is the single highest-leverage CVR lever. The page must deliver what the ad promised — immediately.
The conversion window trap
Setup: A SaaS company compares CVR across two months. Month 1: 4.2%. Month 2: 6.8%. The team celebrates.
- What happened: In Month 2, the marketing manager changed the attribution window from 7-day click to 30-day click. The extra 23 days captured many more conversions that were actually driven by earlier campaigns.
- What they did: Standardized the window to 7-day post-click across all reports.
- Takeaway: Never compare CVR across different attribution windows. Pick one window and stick to it.
Common pitfalls
Confusing CVR with CTR
CTR measures how often people click your ad. CVR measures how often those clicks convert. A high CTR with low CVR means you are driving the wrong traffic. Don’t celebrate clicks alone.
- Instead: Track CVR and CTR side by side. If CTR is high and CVR is low, audit your landing page.
Using the wrong denominator
Some platforms report “conversion rate” as conversions per impression (view-through). This number is always tiny (often <0.1%) and is not comparable to post-click CVR.
- Instead: Always confirm the denominator. For landing page optimization, use post-click CVR (conversions / clicks).
Optimizing for CVR in isolation
Chasing a high CVR can lead to ultra-narrow targeting, small audiences, and missed revenue. A 10% CVR on 100 clicks is worse than a 3% CVR on 10,000 clicks if the latter generates more profit.
- Instead: Optimize for a blended metric like ROAS or profit. Use CVR as a diagnostic, not a North Star.
Ignoring the conversion window
A 30-day window will always show higher CVR than a 1-day window. Changing the window mid-campaign makes trend analysis meaningless.
- Instead: Set a consistent window (7-day post-click is common) and document it. Only compare CVR across campaigns using the same window.
Summary
CVR is a diagnostic lens for post-click performance, not a standalone success metric.
- Always verify the denominator (clicks vs. sessions vs. impressions).
- Read CVR alongside CPA, CTR, and AOV to get the full picture.
- Optimize the whole funnel — targeting, creative, landing page, offer — not just the conversion rate number.
Quick check
Confirm you understood this article.
single
What is the standard denominator for post-click CVR?
Select an answer to continue
References
- Google Ads Help — conversion reporting concepts (conceptual reference)
- Google Analytics — conversion rate definitions (conceptual reference)
- IAB / MRC measurement guidelines — digital audience-based measurement (conceptual reference)
For learning only. Not advice on bids or spend.
You may also like
Metrics
Cost Per Acquisition (CPA)
Cost Per Acquisition (CPA) measures the total advertising cost divided by the number of convers…
CostMetrics
Click-through rate (CTR)
Click-through rate (CTR) measures how often people click your ad after seeing it.
EngagementMetrics
Return on Ad Spend (ROAS)
Return on Ad Spend (ROAS) measures the revenue generated for every dollar spent on advertising.
PerformanceMetrics
Attribution (Conversion Attribution)
Attribution is the set of rules that determines which touchpoints in a customer’s journey get c…
Measurement