Jul 17, 2026·8 min read
Impression
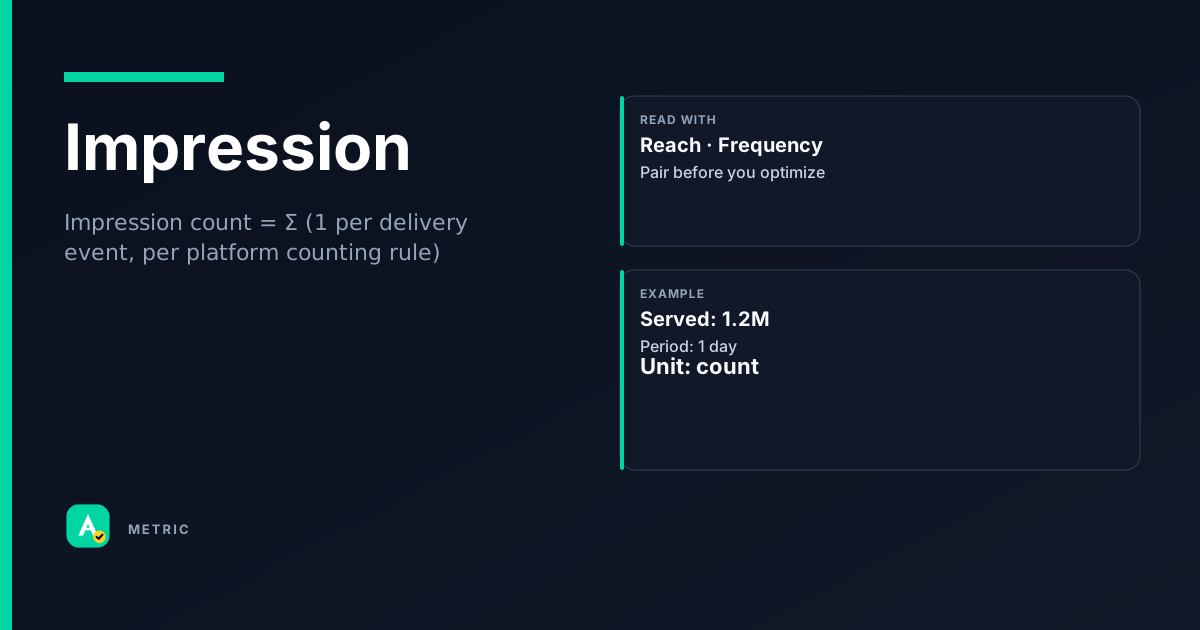
An impression is counted each time an ad is fetched and displayed to a user, per the platform’s counting rule. It is the atomic unit of ad delivery — without impressions, there are no clicks, conversions, or viewability events. But not all impressions are equal: served, rendered, and billed counts can differ, so always check the vendor’s definition. Related: Reach, Frequency, CTR, CPM.
What an impression is
An impression marks the moment an ad is delivered to a potential viewer. In Google Ads, an impression is counted each time an ad is shown on a search results page or other site on the Google Network. The IAB/MRC guidelines define the standard, but platforms implement it differently.
Three common counting methods
- Served impression — counted when the ad server sends the creative to the publisher’s page. Fastest to register, but the ad may not render if the user scrolls away or the page errors.
- Rendered impression — counted when the ad code executes and the creative begins loading in the browser. Closer to what a user could see.
- Billed impression — often tied to viewability thresholds (e.g., 50% of pixels for 1 second for display). Used by many programmatic guarantees.
So what? A campaign that reports 1M served impressions may only deliver 700K rendered impressions. Always confirm which count your platform uses before comparing performance.
How it is calculated
At its simplest, an impression is a count of ad delivery events. There is no arithmetic formula — it is a monotonic counter that increments by 1 each time the platform’s counting rule is satisfied.
Counting rule examples
- Google Ads — counts an impression when the ad is shown on a search results page or Google Network site.
- OpenRTB — the bid request/response cycle counts a served impression when the win notice is sent.
- MRC/IAB — recommends counting at the point the ad begins to render, not when the server sends it.
Why the formula matters
Because there is no single formula, two platforms reporting on the same campaign can show different impression totals. A DSP may count a bid-win as an impression; an SSP may wait until the ad unit fires a pixel. Always check the vendor’s definition.
How to read it in a dashboard
A high impression count means broad delivery, but it says nothing about quality. A common dashboard misread: seeing 2M impressions and assuming strong reach, when the same users saw the ad 10 times each.
Always pair impressions with:
- Reach — unique users exposed. High impressions + low reach = high frequency.
- Viewability rate — how many impressions were actually in-view. Served impressions can be 40% viewable or 80%.
- CTR or conversion rate — did those impressions drive action? A spike in impressions with flat conversions often signals wasted delivery.
So what? If impressions are up 30% week-over-week but conversions are flat, investigate frequency caps and viewability before celebrating scale.
What usually moves this metric
Impression volume is driven by budget, bid strategy, and targeting breadth. If you need more impressions, you widen the funnel. If you need fewer (to reduce waste), you tighten it.
Levers to increase impressions
- Raise budget — more spend buys more opportunities.
- Lower bid or use target CPM — cheaper bids win more auctions, though often on lower-quality inventory.
- Broaden targeting — remove audience exclusions, expand geos, use broader keywords.
- Increase frequency cap — let the same user see the ad more times.
Levers to decrease impressions (quality focus)
- Tighten audience — layer on first-party data or behavioral segments.
- Raise viewability floor — only bid on inventory with >70% viewability.
- Set frequency cap — limit exposure per user per day.
- Use negative keywords / block lists — filter out irrelevant placements.
Tradeoffs
More impressions often mean lower average CPM (cheaper inventory) and lower engagement rates. A home-services advertiser chasing 1M impressions on broad keywords saw CTR drop from 0.8% to 0.2% — more views, fewer leads. When you should NOT chase this metric: when the goal is conversions or brand lift. Optimizing for impression volume alone can inflate costs without delivering results.
Formula
No universal formula — always verify the vendor’s counting method (served vs rendered vs billed).
Scenarios
Served vs. rendered gap
Setup: A publisher reports 500K served impressions in Ad Manager, but the DSP shows only 380K billed impressions. What happened: The DSP counted impressions only after the ad rendered and met a viewability threshold. Fix: Align on a single counting source for reconciliation. Takeaway: Served impressions overstate delivery; always reconcile against the buying platform’s count.
Impression spike, no conversions
Setup: An e-commerce advertiser sees impressions jump 200% after lowering bids to a $0.10 CPM target. What happened: The low bid won cheap, low-quality inventory — mostly pop-under and outstream video that users never engaged with. Fix: Set a minimum viewability floor (e.g., 70%) and use conversion tracking to exclude low-performing placements. Takeaway: More impressions at lower CPM is not a win if conversion rate collapses.
Frequency fatigue from high impressions
Setup: A retail brand runs a retargeting campaign and sees 12M impressions in a week. What happened: No frequency cap was set; the average user saw the ad 18 times. CTR dropped from 0.5% to 0.05% by day 3. Fix: Add a frequency cap of 3 per user per day. Takeaway: High impression counts without frequency controls waste budget and annoy users.
Common pitfalls
Treating all impressions as equal
Served impressions are not the same as viewable impressions. A campaign may report 1M served impressions but only 400K were actually in-view. What to do instead: Always segment by viewability rate and optimize toward viewable impressions, not total served.
Optimizing for impression volume alone
Chasing raw impression count often leads to low-quality inventory, high frequency, and poor engagement. What to do instead: Set a primary KPI (CTR, conversion rate, viewability) and use impressions as a secondary volume metric.
Comparing impression counts across platforms
Google Ads, Meta, and a DSP may all count impressions differently (served vs rendered vs billed). Comparing them directly is misleading. What to do instead: Use a single source of truth for cross-platform reporting, or document each platform’s counting rule.
Summary
An impression is the basic unit of ad delivery, but its definition varies by platform. Key takeaways:
- Always verify whether your platform counts served, rendered, or billed impressions.
- Pair impressions with reach, frequency, and viewability to judge delivery quality.
- Never optimize for impression volume alone — it can mask waste and poor performance.
Quick check
Confirm you understood this article.
single
Which of the following is NOT a common impression counting method?
Select an answer to continue
References
- Google Ads Help — About columns / Impressions (conceptual reference)
- IAB Ad Impression Measurement Guidelines — industry counting standards (conceptual reference)
- MRC Viewable Ad Impression Guidelines — viewability thresholds (conceptual reference)
For learning only. Not advice on bids or spend.
You may also like
Metrics
Cost Per Mille (CPM)
CPM (Cost Per Mille) is the price an advertiser pays for 1,000 ad impressions.
CostMetrics
Click-through rate (CTR)
Click-through rate (CTR) measures how often people click your ad after seeing it.
EngagementMetrics
Frequency (Average Frequency)
Frequency measures how many times, on average, a unique user saw your ad during a campaign peri…
DeliveryMetrics
Reach (Unique Reach)
Reach is the estimated number of unique people who saw your ad at least once during a reporting…
Delivery