Jul 17, 2026·8 min read
Engagement Rate (ER)
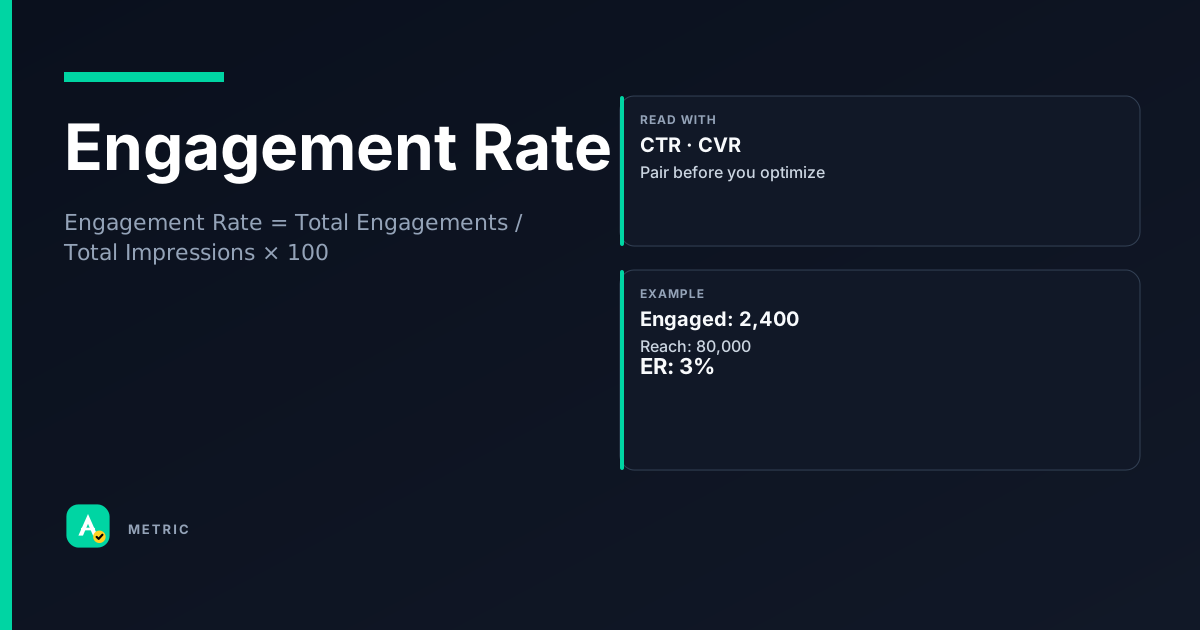
Engagement Rate measures how often people interact with your ad after seeing it. It is a creative diagnostic, not a business outcome. Because every platform defines “engagement” differently — Meta counts reactions, comments, shares; TikTok counts video completions; LinkedIn counts clicks on the profile — you cannot compare raw rates across networks without aligning definitions first. Pair it with CTR and CVR to understand whether interaction leads to conversion.
What it is
Engagement Rate is the percentage of people who performed a specific interactive action on your ad. It answers: Did the ad stop the scroll?
Common actions counted as engagement
- Clicks (link, call-to-action button, carousel swipe)
- Reactions (like, love, care, etc.)
- Comments and shares
- Video views (platform-dependent threshold, e.g., 3 seconds or 50%)
- Saves or bookmarks
What it is NOT
- Not a proxy for conversions or sales
- Not comparable across platforms without normalizing the action set
- Not a reliable bidding target if your goal is downstream revenue
So what
Use engagement rate to compare creative variants within the same platform. A high rate means the ad earned attention; a low rate means the creative or targeting needs a refresh. But a high engagement rate with low conversion rate signals a disconnect between the hook and the offer.
How it is calculated
General formula
Engagement Rate = Total Engagements / Total Impressions × 100
Some platforms (Meta, LinkedIn) offer an alternative: Engagements / Reach × 100. This yields a higher rate because reach ≤ impressions. Always check which denominator your dashboard uses.
Platform caveats
- Meta — Engagements include reactions, comments, shares, link clicks, video views (≥3 seconds), and saves. The denominator is usually reach in the Ads Manager “Engagement Rate” column.
- LinkedIn — Engagements = clicks (any clickable element), reactions, comments, shares, and follows. Denominator is impressions.
- TikTok — Engagements = likes, comments, shares, and video completions. Denominator is impressions.
- X (Twitter) — Engagements = all interactions (likes, retweets, replies, link clicks, media views, etc.). Denominator is impressions.
Never compare raw rates across platforms. A 3% engagement rate on Meta is not the same as 3% on LinkedIn.
How to read it in a dashboard
A single engagement rate number tells you little. Read it in context:
Compare within the same platform, same ad placement, same time window.
- A/B test two headlines: the one with higher engagement rate earned more attention.
- If engagement rate drops week-over-week, the audience may be fatigued or the creative is stale.
Pair it with these metrics to avoid misinterpretation
- CTR — If engagement rate is high but CTR is low, people are reacting but not clicking. The call-to-action may be weak.
- CVR — If engagement rate and CTR are high but CVR is low, the landing page or offer is failing to convert engaged users.
- Viewability — Low engagement rate on a viewable ad suggests the creative itself is the problem, not ad placement.
Dashboard misread example
You see a 6% engagement rate and celebrate. But the denominator is reach (not impressions) and the actions include accidental taps. Meanwhile, CPA is rising. The engagement rate is a vanity metric here — it does not explain the cost problem.
What usually moves this metric
Creative levers
- Hook in the first 1-2 seconds — On TikTok/Reels, the first frame determines whether users engage or swipe away.
- Clear call-to-action — “Shop now” vs. “Learn more” can change engagement rate by 2-3× depending on audience.
- Visual contrast — Bright colors, faces, and motion outperform static text overlays in most feed placements.
- Interactive formats — Polls, sliders, and carousels mechanically increase engagement because each swipe counts as an action.
Targeting levers
- Audience relevance — A perfectly crafted ad shown to the wrong audience will have low engagement. Narrowing interest or lookalike targeting often lifts ER.
- Retargeting — Users who already visited your site tend to engage at higher rates because they recognize the brand.
Tradeoffs
Chasing engagement rate can hurt efficiency.
- A “clickbait” creative may get high engagement but zero conversions. You pay for impressions and interactions but get no revenue.
- Interactive formats (polls, carousels) inflate engagement counts because each user action is counted separately. The same user can generate 5 engagements on one ad. This makes ER look great while CPA stays flat or rises.
When you should NOT chase this metric: If your north star is ROAS or CPA, do not optimize toward engagement rate. Use it as a creative diagnostic only. If engagement rate is high but CPA is high, fix the landing page or offer — not the creative.
Formula
Some platforms (Meta, LinkedIn) use reach instead of impressions as the denominator. Always check the vendor's definition.
Scenarios
High engagement, low conversions
A home-services advertiser ran a video ad with a funny cat opening a door. Engagement rate hit 8% (double the benchmark), but CPA tripled.
What happened: The cat got likes and shares, but viewers did not associate the humor with the service. The call-to-action was a generic “Learn More” with no urgency.
What they did: Replaced the creative with a before/after renovation clip and a “Book now — 10% off” CTA. Engagement rate dropped to 4%, but CPA fell 50%.
Takeaway: High engagement without conversion means the creative entertains but does not sell. Use ER to diagnose creative appeal, not to judge campaign success.
Cross-platform comparison trap
A DTC brand compared Meta engagement rate (5%) with LinkedIn engagement rate (2%) and concluded Meta was more effective.
What happened: Meta counted reactions, comments, shares, and 3-second video views against reach. LinkedIn counted clicks on any element, reactions, comments, and shares against impressions. The denominators and action sets were different.
What they did: Normalized both to clicks-only / impressions. Meta ER became 0.9%; LinkedIn ER became 1.1%. The conclusion reversed.
Takeaway: Never compare raw engagement rates across platforms. Normalize to the same action set and denominator, or use a common metric like CTR.
Interactive format inflation
A fashion retailer ran a carousel ad with 5 products. Each swipe counted as an engagement. The engagement rate was 12%.
What happened: A single user could generate 5 engagements (one per swipe) in one session. The same user seeing the ad twice generated 10 engagements. The rate was inflated by repeat interactions, not new audience interest.
What they did: Switched to a single-image ad for the top-selling product. Engagement rate dropped to 3%, but CTR to the product page increased 2× because the CTA was clearer.
Takeaway: Carousels and polls mechanically inflate engagement counts. Use them for engagement goals (brand awareness) but not for direct-response campaigns where you want a single clear action.
Common pitfalls
Treating engagement rate as a success metric
It is easy to celebrate a high engagement rate in a Slack message: “Our ad is crushing it — 8% ER!” But if CPA is rising, the metric is misleading.
What to do instead:
- Always pair ER with a business metric (CPA, ROAS, CVR).
- Use ER only to compare creative variants within the same platform and placement.
- If ER is high but conversions are low, audit the landing page and offer before changing the creative.
Comparing rates across platforms without normalization
Meta, LinkedIn, TikTok, and X all define “engagement” differently. A 4% ER on TikTok may be equivalent to 1% on LinkedIn after normalizing to clicks-only.
What to do instead:
- Pull the raw action breakdown from each platform.
- Calculate a custom engagement rate using the same action set (e.g., only link clicks and video completions) and the same denominator (impressions).
- Use that normalized rate for cross-platform comparison.
Ignoring the denominator (impressions vs. reach)
If your dashboard shows “Engagement Rate = 10%”, check whether the denominator is impressions or reach. Reach-based ER is always higher because reach ≤ impressions. A 10% reach-based ER may be 4% impressions-based ER.
What to do instead:
- Know your platform’s default. Meta Ads Manager uses reach; LinkedIn Campaign Manager uses impressions.
- If you export data, confirm the column definition in the vendor’s glossary.
- When reporting to stakeholders, state the denominator explicitly: “Engagement Rate (by reach): 10%”.
Summary
Engagement Rate is a creative diagnostic, not a business outcome. Use it to compare ad variants within the same platform, but never optimize toward it at the expense of CPA or ROAS.
- Always check which actions and denominator the platform uses before interpreting the number.
- Pair ER with CTR, CVR, and viewability to understand whether engagement leads to conversion.
- When you see high ER but poor business results, fix the offer or landing page — not the creative.
Quick check
Confirm you understood this article.
single
Which of the following is the most common general formula for Engagement Rate?
Select an answer to continue
Related metrics
References
- Meta Business Help — engagement metrics definitions (conceptual reference)
- LinkedIn Marketing Solutions — ad reporting glossary (conceptual reference)
- TikTok Ads Manager — metrics definitions (conceptual reference)
- IAB Digital Advertising Measurement Guidelines — conceptual reference
For learning only. Not advice on bids or spend.
You may also like
Metrics
Click-through rate (CTR)
Click-through rate (CTR) measures how often people click your ad after seeing it.
EngagementMetrics
Conversion Rate (CVR)
Conversion rate (CVR) measures how often a click (or visit) leads to a desired action — a purch…
PerformanceMetrics
Viewability (Visible Impression Rate)
Viewability measures whether an ad had a reasonable chance of being seen by a human.
QualityMetrics
Take Rate (Platform Fee Share)
Take Rate is the percentage of transaction value that an ad platform (SSP, exchange, ad network…
Economics