Jul 17, 2026·8 min read
Attribution (Conversion Attribution)
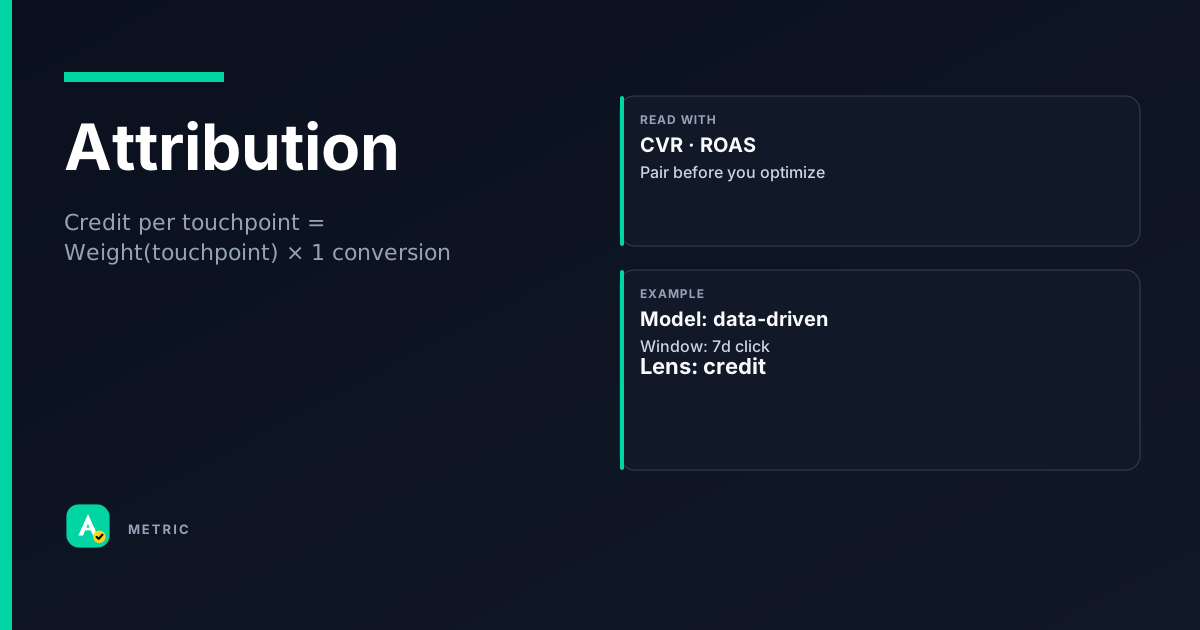
Attribution is the set of rules that determines which touchpoints in a customer’s journey get credit for a conversion. It answers the question: Which ad, click, or impression actually caused the sale? The model you choose — last-click, first-click, linear, or data-driven — directly reshapes your reported ROAS, CPA, and CVR. Without a consistent attribution framework, you cannot compare campaign performance across channels or time.
What attribution is
Attribution is the logic that distributes conversion credit across ad interactions. A single purchase might be preceded by a search ad click, a social video view, and an email open — attribution decides which gets the credit (and how much).
Why it matters: Your ROAS and CPA numbers are only as reliable as the attribution model behind them. Two advertisers running the same campaign but using different models will see different “winners” and make different budget decisions.
Common attribution models
- Last-click: 100% credit to the last click before conversion. Simple, but ignores all earlier awareness work.
- First-click: 100% credit to the first interaction. Useful for understanding top-of-funnel effectiveness.
- Linear: Equal credit to every touchpoint. Fair but noisy.
- Time-decay: More credit to touchpoints closer to conversion. A middle ground.
- Data-driven (algorithmic): Uses historical data to assign fractional credit based on each touchpoint’s incremental impact. Available in Google Ads and Meta for accounts with sufficient conversion volume.
So what: Choose a model that matches your decision horizon. If you optimize for same-day purchases, last-click may be fine. If you run multi-week nurture sequences, you need a model that credits early touchpoints.
How it is calculated
There is no single formula for attribution — the calculation depends on the model. But the general structure is:
Conversion credit per touchpoint = Weight(touchpoint) × 1 conversion
Where Weight is defined by the model:
- Last-click: Weight = 1 for the final touch, 0 for all others.
- Linear: Weight = 1 / (number of touchpoints in the path).
- Time-decay: Weight = e^(−λ × time gap) normalized across touchpoints.
- Data-driven: Weight = predicted incremental lift of that touchpoint from a machine-learning model.
Important caveats
- Lookback window — Conversions outside the window get zero credit. A 30-day click window vs. a 7-day click window will produce very different attribution splits.
- Conversion action — Attribution is per conversion action (purchase, sign-up, add-to-cart). Mixing actions in one report can distort results.
- Cross-device — Most platforms cannot stitch a user across devices unless they are logged in. Reported attribution is often device-specific.
- Privacy changes — With signal loss (cookie deprecation, iOS App Tracking Transparency), platforms rely more on modeled conversions. Treat reported ROAS with uncertainty; always check the “modeled vs. observed” breakdown if available.
How to read it in a dashboard
Attribution is not a single number — it is a setting that changes every other metric. When you look at a dashboard, the first thing to check is which attribution model is applied. If the label says “Last-click” or “Data-driven,” you know the ROAS and CPA numbers are calculated under that rule.
What to look for:
- Model label — Usually shown in the report header or a dropdown. If missing, assume last-click (the platform default in most tools).
- Lookback window — 30-day click / 1-day view? 7-day click? This can change CPA by 20-40% for consideration-stage products.
- Conversion action — Are you looking at “All conversions” or a specific action? Mixing actions inflates ROAS.
What to pair it with:
- Path length — Average number of touchpoints before conversion. If it’s >3, last-click will undercredit your upper-funnel channels.
- Assisted conversions — A report that shows which channels appeared in the path but did not get the last click. High assisted conversion share = the channel is doing awareness work.
- Model comparison — Run a side-by-side report (e.g., last-click vs. data-driven) to see which channels gain or lose credit. The difference is your “attribution gap.”
What usually moves this metric
Attribution is a setting, not a lever you pull daily. But you can influence how credit flows by changing campaign structure, bidding strategy, and measurement setup.
Levers that shift attribution outcomes
- Conversion window — Shortening the lookback window concentrates credit on last-click channels. Lengthening it spreads credit to earlier touchpoints.
- Bid strategy — Target CPA and Target ROAS bid strategies optimize toward the attribution model you have selected. Switching from last-click to data-driven can cause bids to shift spend toward upper-funnel placements.
- Campaign structure — Separating prospecting (awareness) campaigns from retargeting (conversion) campaigns makes it easier to see each channel’s role. Blended campaigns make attribution noisy.
- Offline conversion import — If you import phone calls or in-store purchases, attribution becomes more complete. Without it, digital touchpoints that drive offline sales get zero credit.
Tradeoffs
- Last-click is simple but blind — It overcredits the final touch and starves upper-funnel channels. You may see CPA drop in the short term while total addressable audience shrinks.
- Data-driven is smarter but data-hungry — It requires ~300+ conversions per campaign per 30 days to stabilize. Below that, the model may flip credit randomly week to week.
- Multi-touch models (linear, time-decay) are fair but imprecise — They assume all touchpoints matter equally (linear) or that recency is the only factor (time-decay). They do not measure true incrementality.
Easy mistake: A home-services advertiser switched from last-click to linear and saw ROAS drop 30%. They panicked and switched back. The drop was expected — linear simply spread credit across more touchpoints. The actual revenue had not changed. Always run a model comparison report before changing your optimization model.
Formula
Weight depends on the model (last-click, linear, time-decay, data-driven). Always check the lookback window and conversion action — they change the input set.
Scenarios
The retargeting overcredit trap
Setup: A DTC brand runs prospecting (social video) and retargeting (search). Under last-click, search gets 80% of conversion credit. The team cuts social budget because it “doesn’t convert.”
- What happened: Social was driving awareness; retargeting was harvesting demand. Cutting social caused retargeting CPA to double because fewer people entered the funnel.
- What they did: Switched to data-driven attribution. Social’s assisted conversion share was 60%. They restored social budget and set a blended ROAS target.
- Takeaway: Last-click overcredits the final touch. Use assisted conversions or data-driven attribution to see the full funnel.
Lookback window mismatch
Setup: A B2B SaaS company uses a 7-day click window. Their sales cycle is 60 days. Most conversions are attributed to the last touch, usually a demo request.
- What happened: Blog posts and webinars — which drive early awareness — got zero credit. The team was about to kill the blog.
- What they did: Extended the lookback window to 90 days and switched to time-decay. Blog and webinar now showed 25% of conversion credit.
- Takeaway: Match the lookback window to your actual purchase cycle. Short windows hide upper-funnel value.
Privacy-driven attribution shift
Setup: An e-commerce retailer saw ROAS jump 15% after iOS 14.5. The team celebrated — until they noticed revenue was flat.
- What happened: Meta’s attribution model switched from observed to modeled conversions for iOS users. Modeled conversions inflated ROAS because the platform imputed credit for unobserved touchpoints.
- What they did: Ran a holdout test (incrementality measurement) to compare attributed ROAS vs. true lift. Found the true ROAS was 8% lower than reported. Adjusted budgets accordingly.
- Takeaway: Privacy changes increase modeled conversions. Treat reported ROAS with uncertainty and validate with incrementality tests.
Common pitfalls
Assuming last-click is “accurate”
Last-click is the default in most platforms, but it is not accurate — it is simple. It ignores every touchpoint that built awareness and consideration.
- What to do instead: Use a model comparison report to see how credit shifts. If you cannot switch models, at least look at assisted conversions to understand channel roles.
Changing attribution model without telling the team
Switching from last-click to data-driven can change ROAS by 20-30% overnight — even if revenue is flat. If the team does not know, they may make bad budget decisions.
- What to do instead: Announce the change, run both models side-by-side for two weeks, and set new baselines before optimizing toward the new model.
Comparing ROAS across platforms with different models
Google Ads may use data-driven attribution; Meta may use last-click. Comparing their ROAS numbers directly is meaningless.
- What to do instead: Export raw conversion data to a unified analytics tool and apply the same attribution model to all channels. Or use platform-agnostic measurement like Google Analytics 4.
Summary
Attribution is the lens through which you see campaign performance — change the lens, change the picture. Key takeaways:
- Always state the attribution model, lookback window, and conversion action when reporting ROAS or CPA.
- Last-click is simple but hides upper-funnel value; data-driven is better but requires volume.
- Privacy changes increase modeled conversions — validate with incrementality tests or holdout experiments.
Quick check
Confirm you understood this article.
single
Which attribution model gives 100% credit to the final click before a conversion?
Select an answer to continue
References
- Google Ads Help — attribution models overview (conceptual reference)
- Meta Business Help Center — attribution and conversion reporting (conceptual reference)
- Think with Google — measurement resources: https://www.thinkwithgoogle.com/
- IAB / MRC measurement guidelines — digital attribution standards (conceptual reference)
For learning only. Not advice on bids or spend.
You may also like
Metrics
Cost Per Acquisition (CPA)
Cost Per Acquisition (CPA) measures the total advertising cost divided by the number of convers…
CostMetrics
Conversion Rate (CVR)
Conversion rate (CVR) measures how often a click (or visit) leads to a desired action — a purch…
PerformanceMetrics
Return on Ad Spend (ROAS)
Return on Ad Spend (ROAS) measures the revenue generated for every dollar spent on advertising.
PerformanceMetrics
Second-Price Auction
Second-Price Auction is a bidding mechanism where the winning bidder pays the price of the seco…
Auction