Jul 17, 2026·7 min read
Cost Per Install (CPI)
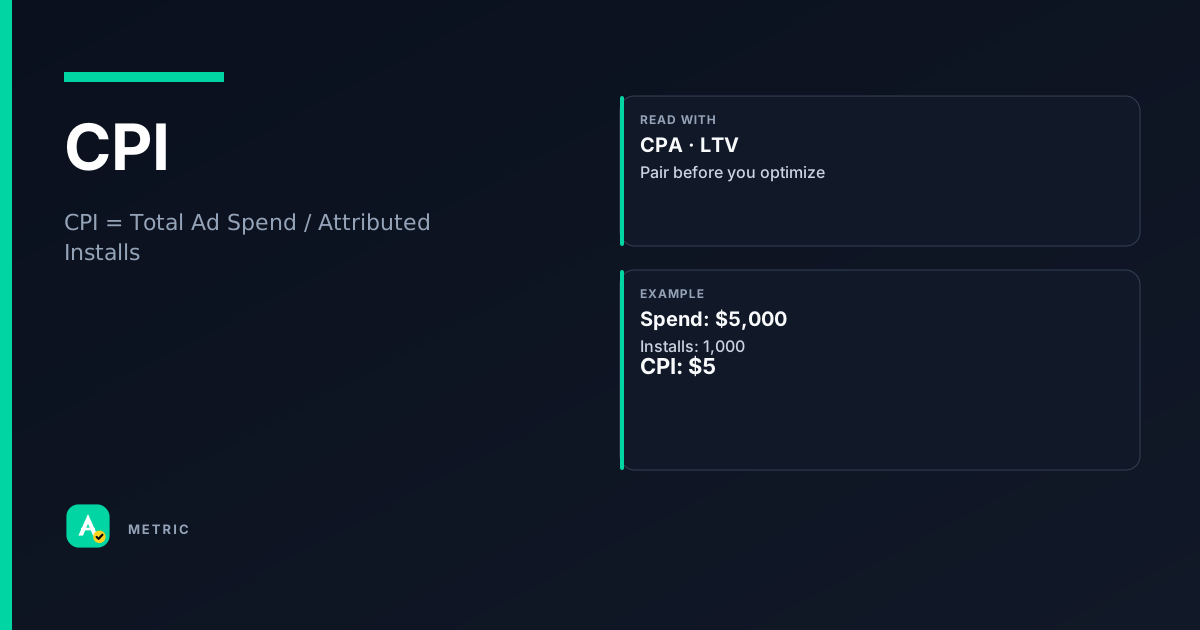
CPI measures the cost to acquire one app install. It is the most common unit-economics metric for mobile user acquisition campaigns. Because an install is not a retained user, CPI must be judged alongside retention and LTV to avoid buying low-quality traffic.
What CPI is
Cost Per Install (CPI) is the advertiser-side cost metric for mobile app campaigns. It answers: How much did I pay, on average, for each new install?
CPI is the dominant pricing model in mobile user acquisition because it aligns payment with a clear, trackable event — the first app open after download. However, an install is a thin signal. Privacy changes (Apple’s ATT, Google’s Privacy Sandbox) and SKAdNetwork delays have made install attribution less deterministic, increasing the gap between reported installs and actual new users.
What CPI does NOT tell you
- Whether the user opened the app again (retention)
- Whether they performed any in-app action (engagement)
- Whether they generated revenue (LTV)
So what: Treat CPI as a volume and cost-efficiency metric, never as a success metric. Pair it with Day-1 retention and LTV to judge true campaign health.
How CPI is calculated
CPI = Total Ad Spend / Number of Attributed Installs
Both the numerator and denominator have important caveats.
Spend caveats
- Include media cost, platform fees, and any managed-service markups.
- Exclude VAT or sales tax unless your accounting treats them as cost.
Install attribution caveats
- Attribution is handled by a mobile measurement partner (MMP) or the ad platform’s own SDK.
- The MMP uses last-click or last-touch models (typically 7-day click, 1-day view-through).
- Under SKAdNetwork (SKAN), installs are aggregated and delayed — CPI reported by the platform may differ from the MMP’s CPI.
- Google App Campaigns and Meta App Ads each have their own attribution windows; always compare like-for-like.
Example
- Spend: $10,000
- Attributed installs: 2,500
- CPI = $10,000 / 2,500 = $4.00
How to read CPI in a dashboard
A single CPI number is meaningless without context. Read it against three reference points:
- Target CPI — the maximum you can pay while still hitting your LTV-to-CPI ratio (e.g., 3× LTV / CPI)
- Benchmark CPI — your historical average or industry vertical average (e.g., casual games vs. fintech)
- CPI by cohort — CPI for users acquired via different creatives, audiences, or geos
What to pair it with
- Day-1 retention rate — a low CPI with <20% Day-1 retention is usually a bad trade
- LTV / CPI ratio — the real efficiency metric. If LTV is $12 and CPI is $4, ratio = 3.0
- Install-to-registration or install-to-first-purchase rate — bridges installs to meaningful actions
Common dashboard misread
“CPI dropped 30% this week — great performance!”
If the drop came from cheap, low-retention inventory (e.g., incentivized installs), your effective cost per retained user may have increased. Always check retention alongside CPI.
What usually moves CPI
Creative and messaging
- Video vs. static: Video ads often drive higher install rates, lowering CPI — but only if the video clearly communicates the app’s value.
- Ad copy: A mismatch between creative promise and app store page increases cost (low conversion rate → higher CPI).
Audience targeting
- Broad vs. narrow: Overly narrow targeting can increase CPI due to limited auction supply; overly broad targeting may attract low-intent users.
- Lookalike audiences: Quality depends on the seed audience. A seed of high-LTV users usually yields better CPI-to-retention balance.
Platform and bid strategy
- Google App Campaigns and Meta App Ads optimize toward installs by default. Switching to an in-app event optimization (e.g., purchase) often raises CPI but improves LTV.
- Bid type: Target CPI (if available) caps cost but may limit volume. Maximize installs with a budget cap can lower CPI but risks quality.
Seasonality and competitive pressure
- CPI typically rises in Q4 (holiday UA) and during major product launches from competitors.
Tradeoffs
Lowering CPI in isolation is a trap. The common playbook — use cheap incentivized networks, broad targeting, and low-friction creatives — often produces a CPI that looks great on Monday and a retention chart that looks terrible on Friday. Optimize for retained-user CPI or LTV-to-CPI ratio, not raw CPI.
Formula
Attribution window and MMP logic affect the install count; compare CPI only within the same attribution setup.
Scenarios
The cheap-install trap
A hyper-casual game publisher saw CPI drop from $0.45 to $0.28 after switching to a rewarded video network.
What happened: Day-1 retention fell from 32% to 12%. Most users never opened the app again. What they did: Reverted to non-incentivized channels and set a minimum Day-1 retention threshold (25%) in their campaign dashboard.
Takeaway: A low CPI is worthless if users churn before Day 1. Always gate CPI improvements with a retention floor.
SKAN attribution gap
A fintech app running iOS campaigns saw platform-reported CPI of $3.80 but MMP-reported CPI of $5.10.
What happened: SKAdNetwork delayed and aggregated installs; the platform counted installs that the MMP couldn’t verify within the same window. What they did: Standardized on the MMP’s CPI as the source of truth and adjusted platform bids to target a blended CPI of $4.50.
Takeaway: When SKAN is in play, reconcile platform and MMP CPI weekly. The gap is normal — decide which number drives your budget decisions.
Geo expansion mistake
A subscription app expanded into Brazil and India, achieving a blended CPI of $1.20 — half their US CPI.
What happened: Retention in those markets was 40% lower, and LTV was 60% lower. The blended CPI masked a poor unit economy. What they did: Segmented CPI by country and set separate target CPIs based on local LTV models.
Takeaway: Blended CPI hides regional differences. Always segment by geo and compare CPI against local LTV.
Common pitfalls
CPI is not a success metric
Treating CPI as the north star leads to buying cheap, low-quality traffic.
What to do instead:
- Set a target CPI based on LTV breakeven (e.g., LTV / 3)
- Monitor CPI alongside Day-1 retention and in-app conversion rate
- Run a cohort analysis monthly: compare CPI cohorts by LTV after 30 days
Ignoring attribution differences
Comparing CPI from Google App Campaigns (last-click, 30-day window) with CPI from a third-party network (last-click, 7-day window) is misleading.
What to do instead:
- Always note the attribution window and model when reporting CPI
- Use a single MMP as the source of truth for cross-platform comparisons
- Reconcile platform-reported CPI with MMP CPI weekly
Optimizing CPI during a campaign without checking delivery
A common Slack message: “CPI is rising — lower the bid.” If you lower the bid too aggressively, the campaign may stop spending entirely (low delivery).
What to do instead:
- Check impression share and spend velocity before adjusting bids
- Lower bids gradually (10-15% per change) and wait 24-48 hours
- If CPI is high due to low conversion rate, fix the app store page or creative first
Summary
CPI is a necessary but incomplete metric for mobile app advertising. It tells you the cost of getting a foot in the door — nothing about whether that foot stays.
- Always pair CPI with Day-1 retention and LTV to judge true efficiency.
- Standardize attribution windows and source of truth (MMP) before comparing CPI across campaigns.
- Optimize for retained-user CPI or LTV-to-CPI ratio, never raw CPI alone.
Quick check
Confirm you understood this article.
single
What does CPI stand for?
Select an answer to continue
References
- Mobile measurement partner documentation (install attribution concepts — e.g., Adjust, AppsFlyer, Branch)
- Google Ads Help glossary — Cost-per-install (CPI) definition
- Meta Business Help Center — App install ad pricing and attribution
For learning only. Not advice on bids or spend.
You may also like
Metrics
Cost Per Acquisition (CPA)
Cost Per Acquisition (CPA) measures the total advertising cost divided by the number of convers…
CostMetrics
Lifetime Value (LTV)
Lifetime Value (LTV) estimates the total net revenue a single customer (or cohort) will generat…
ValueMetrics
Return on Ad Spend (ROAS)
Return on Ad Spend (ROAS) measures the revenue generated for every dollar spent on advertising.
PerformanceMetrics
Bid Response (Bid Resp)
Bid Response is the message a bidder sends back to an exchange after receiving a Bid Request.
Auction