Jul 17, 2026·7 min read
Customer Acquisition Cost (CAC)
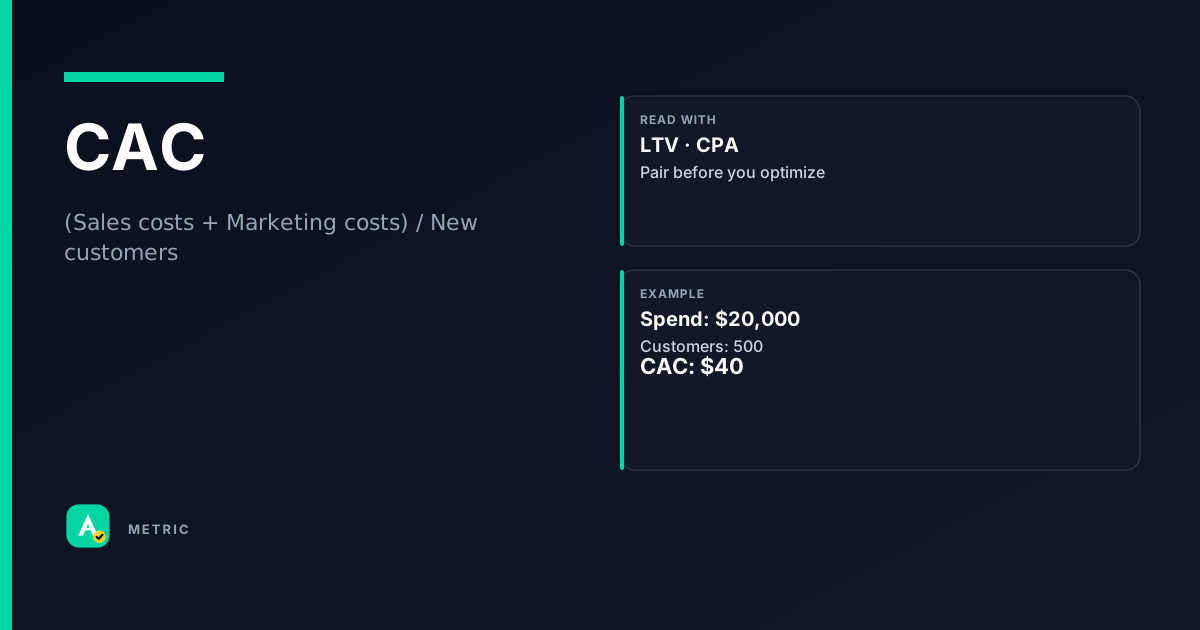
Customer Acquisition Cost (CAC) is the total cost of convincing a prospect to become a paying customer. It is the denominator in any unit-economics equation. If you do not know your CAC, you cannot know whether your marketing is building value or burning cash. Always pair CAC with LTV before making budget decisions.
What it is
CAC answers a simple question: How much did we spend to earn one new customer? It aggregates every dollar spent on sales and marketing activities that directly contributed to acquiring customers during a given period.
Blended vs. paid CAC — label which you use
- Blended CAC = total sales + marketing costs / all new customers (including organic, referral, direct). Useful for overall business health.
- Paid CAC = only paid-media costs / customers acquired through paid channels. Essential for channel-level optimization.
- Fully loaded CAC includes salaries, tools, overhead. Use this when evaluating long-term business model viability.
Easy mistake: A team reports CAC dropping from $50 to $30 and celebrates. What they missed: they excluded sales salaries in the second month. Always state the scope — paid CAC, blended CAC, or fully loaded CAC.
How it is calculated
CAC = (Sales costs + Marketing costs) / New customers acquired
Where:
- Sales costs: salaries, commissions, CRM tools, sales enablement
- Marketing costs: ad spend, creative production, marketing automation, agency fees
- New customers: first-time paying customers in the same period
Important caveats
- Time alignment: Match the cost period to the acquisition period. If you spend $100k in January but customers convert in February, use February's customer count.
- Attribution model: Last-click, first-touch, and multi-touch attribution will assign costs differently. State your model alongside the CAC number.
- Exclude organic when calculating paid CAC — otherwise you dilute the metric and cannot optimize channels.
- Recurring vs. one-time: Some teams include only first-purchase costs; others include costs to convert a free trial user. Be explicit.
How to read it in a dashboard
A single CAC number is meaningless without context. Read it alongside:
- LTV (Lifetime Value): The golden ratio is LTV / CAC. A ratio of 3× or higher is generally healthy; below 1× means you lose money on every customer.
- Payback period: How many months until gross profit from a customer covers CAC. Shorter is better.
- Channel-level CAC: If blended CAC is $80 but paid search CAC is $120 and organic CAC is $30, the blended number hides a problem.
When you should NOT chase this metric: Do not optimize CAC in isolation during a growth phase if LTV is strong and payback period is acceptable. Cutting spend to lower CAC can starve growth. The goal is profitable scale, not minimum cost.
What usually moves this metric
Lowering CAC
- Improve conversion rate: Higher conversion means more customers from the same spend. Test landing pages, checkout flow, and ad creative.
- Optimize channel mix: Shift budget toward channels with lower paid CAC (e.g., from display to search if search converts better).
- Reduce wasted spend: Pause underperforming campaigns, tighten audience targeting, use negative keywords.
- Sales efficiency: Shorten sales cycle, improve lead scoring, automate follow-ups.
Raising CAC (intentionally)
- Enter new channels: Initial testing in a new channel often has high CAC before optimization.
- Target higher-value segments: Premium audiences may cost more to acquire but yield higher LTV.
- Scale aggressively: Bidding into higher auction positions increases cost per click and thus CAC.
Tradeoffs
CAC does not exist in a vacuum. A home-services advertiser cut CAC by 40% by pausing all prospecting campaigns and running only retargeting. Short-term CAC looked great, but new customer volume dropped 70% and LTV/CAC ratio collapsed because they stopped acquiring fresh leads. Always balance CAC with volume and LTV.
Formula
Platforms like Google Ads and Meta do not report CAC directly — you must export cost and conversion data to a spreadsheet or BI tool. Some analytics platforms (e.g., Triple Whale, Northbeam) calculate it automatically if you configure attribution.
Scenarios
SaaS trial-to-paid CAC
A B2B SaaS company spent $40k on ads and $20k on sales salaries in Q1, acquiring 200 new paid subscribers. Blended CAC = $300.
- Cause: High sales touch for low-ticket product ($50/mo). LTV was only $600, giving a 2× ratio — below the 3× benchmark.
- Fix: Introduced self-serve onboarding and reduced sales involvement for accounts under $200/mo. Next quarter: CAC dropped to $180, LTV/CAC improved to 3.3×.
- Takeaway: Match sales intensity to customer value. Over-servicing low-value accounts inflates CAC.
E-commerce paid CAC spike
An apparel brand saw paid CAC jump from $25 to $45 in one month. Blended CAC only moved from $18 to $22.
- What happened: A new competitor entered their paid search market, driving up CPCs. Organic and email channels were unaffected.
- What they did: Shifted 20% of paid search budget to influencer partnerships and email acquisition. Paid CAC stabilized at $35; blended CAC stayed at $20.
- Takeaway: Monitor paid CAC separately. A spike in one channel does not mean the whole business is broken.
Fully loaded CAC reveals hidden costs
A mobile app company reported paid CAC of $2.50 based on ad spend alone. But when they added creative production ($0.30/install), attribution tool ($0.10), and marketing salaries ($0.60), fully loaded CAC was $3.50.
- Cause: They were optimizing against an incomplete cost base.
- Fix: Built a cost model that allocated all variable and fixed marketing costs per install. Realized their breakeven CPI was $3.00 — they were losing money on every install.
- Takeaway: Fully loaded CAC is the only honest number for unit economics. Blended and paid CAC are useful for channel decisions, not profitability.
Common pitfalls
Comparing CAC across different time windows
A 30-day CAC and a 90-day CAC are not comparable. Longer windows capture more costs and more customers, but the ratio can shift.
- Do this instead: Always use the same lookback window. If you change windows, re-baseline your LTV/CAC ratio.
Ignoring organic customers in blended CAC
If organic acquisition is strong, blended CAC looks artificially low. A team might think they can scale paid channels, but paid CAC is actually much higher.
- Do this instead: Report both blended and paid CAC. Use paid CAC for channel budget decisions and blended CAC for overall business health.
Celebrating a CAC drop without checking volume
Cutting spend always lowers CAC — but it also lowers customer count. A $20 CAC with 10 customers is worse than a $40 CAC with 500 customers if LTV supports it.
- Do this instead: Track CAC alongside new customer count and LTV/CAC ratio. Optimize for profitable scale, not minimum cost.
Summary
CAC is the cost side of the unit-economics equation — it only matters in relation to LTV and volume. Key takeaways:
- Always specify blended, paid, or fully loaded CAC.
- Pair CAC with LTV to calculate LTV/CAC ratio (target 3×+).
- Do not optimize CAC in isolation; balance cost, volume, and payback period.
Quick check
Confirm you understood this article.
single
Which CAC type is most useful for channel-level optimization?
Select an answer to continue
References
- Startup/finance definitions for customer acquisition cost (e.g., HubSpot, Investopedia — conceptual reference)
- Performance marketing practice distinguishing blended vs paid CAC (e.g., Reforge, Triple Whale — conceptual reference)
- IAB measurement guidelines — conceptual reference for attribution and cost allocation
For learning only. Not advice on bids or spend.
You may also like
Metrics
Cost Per Acquisition (CPA)
Cost Per Acquisition (CPA) measures the total advertising cost divided by the number of convers…
CostMetrics
Lifetime Value (LTV)
Lifetime Value (LTV) estimates the total net revenue a single customer (or cohort) will generat…
ValueMetrics
Return on Ad Spend (ROAS)
Return on Ad Spend (ROAS) measures the revenue generated for every dollar spent on advertising.
PerformanceMetrics
Effective Cost Per Mille (eCPM)
eCPM (effective cost per mille) is the revenue a publisher earns per thousand ad impressions, r…
Revenue