Jul 17, 2026·7 min read
Average Order Value (AOV)
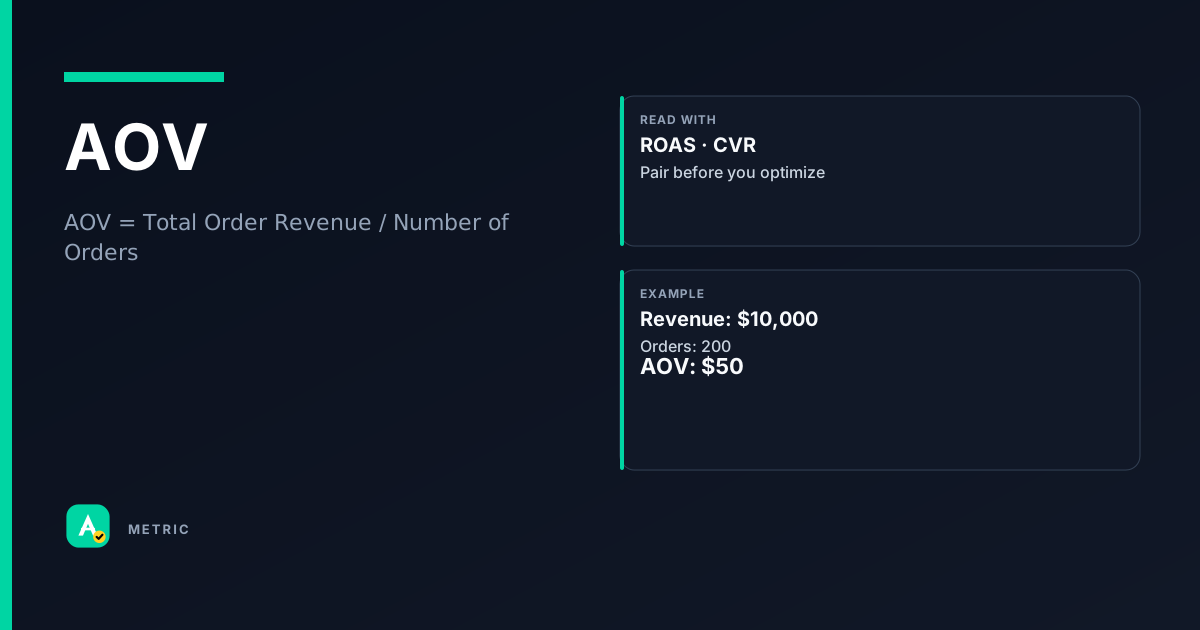
Average Order Value (AOV) measures the average revenue generated per order placed. It is a core e-commerce metric that connects pricing strategy with campaign performance. AOV × conversion rate × traffic volume approximates total revenue, making it a direct lever for improving return on ad spend without requiring more clicks or visitors.
What AOV is and why it matters
Average Order Value (AOV) tells you how much a customer spends each time they complete a purchase. It is calculated by dividing total order revenue by the number of orders in a given period.
AOV sits at the intersection of pricing, merchandising, and marketing. A high AOV means each transaction contributes more to covering acquisition costs and generating profit. A low AOV signals that customers are buying only single, low-priced items — which can make positive ROAS harder to achieve.
Why advertisers watch it
- AOV is a direct input to revenue = AOV × CVR × traffic. Raising AOV lifts revenue without needing more traffic or higher conversion rates.
- It helps set bidding and budget targets. If your AOV is $50, you can afford a higher cost-per-click than if it were $20, assuming the same conversion rate.
- AOV is a health check for merchandising. Changes in AOV often reflect shifts in product mix, bundle adoption, or shipping threshold behavior.
So what: AOV is not a vanity metric. It is a structural lever that determines how much room you have in your acquisition funnel.
How AOV is calculated
AOV = Total Order Revenue / Number of Orders
Total Order Revenue includes the gross value of the order before discounts, taxes, and shipping. Most platforms use gross revenue, but always check your vendor’s definition.
Caveats and clarifications
- Discounts and coupons: If a $100 order gets a $20 coupon, some platforms record $80 as revenue, others $100. The difference changes AOV. Know which your system uses.
- Returns and refunds: AOV is typically calculated on gross orders, not net of returns. This can inflate the metric for businesses with high return rates.
- Order vs. transaction: A single checkout containing multiple shipments counts as one order. AOV aggregates across all items in that order.
- Currency and time zone: AOV is sensitive to the time zone boundary of your reporting day. A spike at midnight can split one day’s orders into two.
So what: Always confirm the revenue definition before comparing AOV across platforms or periods.
How to read AOV in a dashboard
A single AOV number tells you little. Always read it in context — compared to a prior period, a target, or a segment.
What to look for
- Trend direction: Is AOV rising week over week? A steady climb suggests upselling or bundling is working. A sudden drop may indicate a shift to cheaper products or aggressive discounting.
- Segment differences: Compare AOV by channel (paid search vs. email), device (mobile vs. desktop), or customer type (new vs. returning). Mobile AOV is often lower — that’s normal, but the gap should be monitored.
- Cohort behavior: New customers often have lower AOV than repeat buyers. If new-customer AOV is falling, your acquisition mix may be attracting deal-seekers.
Pair AOV with these metrics
- CVR: AOV × CVR = revenue per visitor. If AOV rises but CVR drops, total revenue per visitor may stay flat.
- ROAS: AOV directly feeds ROAS. A $5 increase in AOV can turn a breakeven campaign into a winner.
- LTV: AOV is a component of LTV. If AOV is high but repeat purchase rate is low, LTV may still be weak.
So what: Don’t celebrate an AOV increase until you check whether it came from genuine upselling or from a mix shift toward high-ticket items that convert less often.
What usually moves AOV
AOV is a merchandising and pricing metric more than a campaign metric. Most levers live on the website or in the offer, not in the ad platform.
Pricing & product levers
- Bundles and kits: Offer a set of complementary items at a slight discount vs. buying separately. Customers perceive value; you get higher AOV.
- Volume discounts: “Buy 3, get 10% off” encourages larger baskets.
- Tiered pricing: Higher-priced variants (premium, large size) naturally lift AOV when chosen.
Upsell & cross-sell levers
- Post-add-to-cart upsells: Show a “customers also bought” or “add protection plan” after the main item is in the cart.
- Checkout cross-sells: Low-commitment add-ons (e.g., “add a gift receipt for $1”) can nudge AOV without friction.
- Subscription bumps: Offer a subscription version of the product at checkout — higher lifetime value per order.
Shipping & threshold levers
- Free shipping thresholds: “Free shipping on orders over $50” is one of the most effective AOV drivers. Customers add items to qualify.
- Minimum order amounts: Enforce a minimum for certain payment methods or promotions.
Tradeoffs
- AOV vs. CVR: Raising AOV (e.g., by requiring a minimum) can reduce conversion rate. Some customers abandon. Test the net effect on revenue per visitor.
- AOV vs. order frequency: A very high AOV might discourage repeat purchases if the product is a big-ticket item. For consumables, moderate AOV with high frequency often wins.
- AOV vs. discount depth: Deep discounts can inflate order count but depress AOV. The revenue per visitor may drop even if AOV looks stable.
So what: Pick one lever at a time, measure the impact on both AOV and CVR, and let revenue per visitor be your decision metric.
Formula
Revenue definition varies by platform — some use gross order value, others use net after discounts. Always check your vendor’s documentation.
Scenarios
The free-shipping threshold lift
A home-goods retailer noticed AOV hovered at $42, just below their $50 free-shipping threshold. What happened: Most customers added one item and checked out. What they did: They raised the threshold to $55 and promoted “free shipping on orders over $55” site-wide. AOV climbed to $58 within two weeks. Takeaway: A visible, achievable threshold can pull AOV up — but test to ensure the gain isn’t offset by abandoned carts.
The bundle that backfired
A skincare brand launched a “starter kit” bundle at a 15% discount. What happened: AOV rose 20%, but conversion rate dropped 25%. Revenue per visitor fell. What they did: They unbundled the kit, kept the individual items, and added a “complete the routine” cross-sell at checkout. AOV stayed high (+12%) while CVR recovered. Takeaway: Bundles can suppress conversion if the price point scares new buyers. Test the net revenue effect, not just AOV.
The mobile checkout squeeze
A fashion retailer saw desktop AOV of $85 vs. mobile AOV of $52. What happened: Mobile users rarely added more than one item — the cart interface was clunky. What they did: They simplified the mobile cart, added one-tap “add another color” suggestions, and enabled Apple Pay. Mobile AOV rose to $68. Takeaway: AOV gaps between devices often point to UX friction, not customer intent.
Common pitfalls
Chasing AOV at the expense of conversion rate
Raising AOV by increasing minimum order thresholds or pushing expensive bundles can scare away price-sensitive customers. What to do instead: Track revenue per visitor (AOV × CVR) as your north star. If AOV goes up but CVR goes down more, you lose money.
Comparing AOV across platforms without normalizing revenue definitions
One platform counts gross order value including tax and shipping; another uses net after discounts. Comparing them directly is misleading. What to do instead: Export raw order data and calculate AOV using a consistent definition in your analytics tool.
Ignoring the impact of returns on true AOV
AOV is usually calculated on gross orders. If 30% of orders are returned, the real revenue per order is much lower. What to do instead: Track net AOV (revenue after returns / orders) alongside gross AOV to understand true unit economics.
Summary
AOV is a structural revenue lever that connects pricing, merchandising, and advertising performance.
- Raising AOV can improve ROAS without increasing traffic or conversion rate.
- Always pair AOV with CVR and revenue per visitor to avoid optimization traps.
- Test one lever at a time (bundles, thresholds, upsells) and measure the net impact on profit, not just order value.
Quick check
Confirm you understood this article.
boolean
AOV is calculated by dividing total order revenue by the number of orders.
Select an answer to continue
References
- E-commerce analytics practice — conceptual definition (order revenue / orders)
- Think with Google — retail measurement resources
- Google Ads Help — average order value definition
For learning only. Not advice on bids or spend.
You may also like
Metrics
Conversion Rate (CVR)
Conversion rate (CVR) measures how often a click (or visit) leads to a desired action — a purch…
PerformanceMetrics
Lifetime Value (LTV)
Lifetime Value (LTV) estimates the total net revenue a single customer (or cohort) will generat…
ValueMetrics
Return on Ad Spend (ROAS)
Return on Ad Spend (ROAS) measures the revenue generated for every dollar spent on advertising.
PerformanceMetrics
Session RPM (Revenue Per Mille Sessions)
Session RPM (Revenue Per Mille Sessions) measures estimated earnings per thousand user sessions.
Revenue