Jul 17, 2026·7 min read
Ad Density
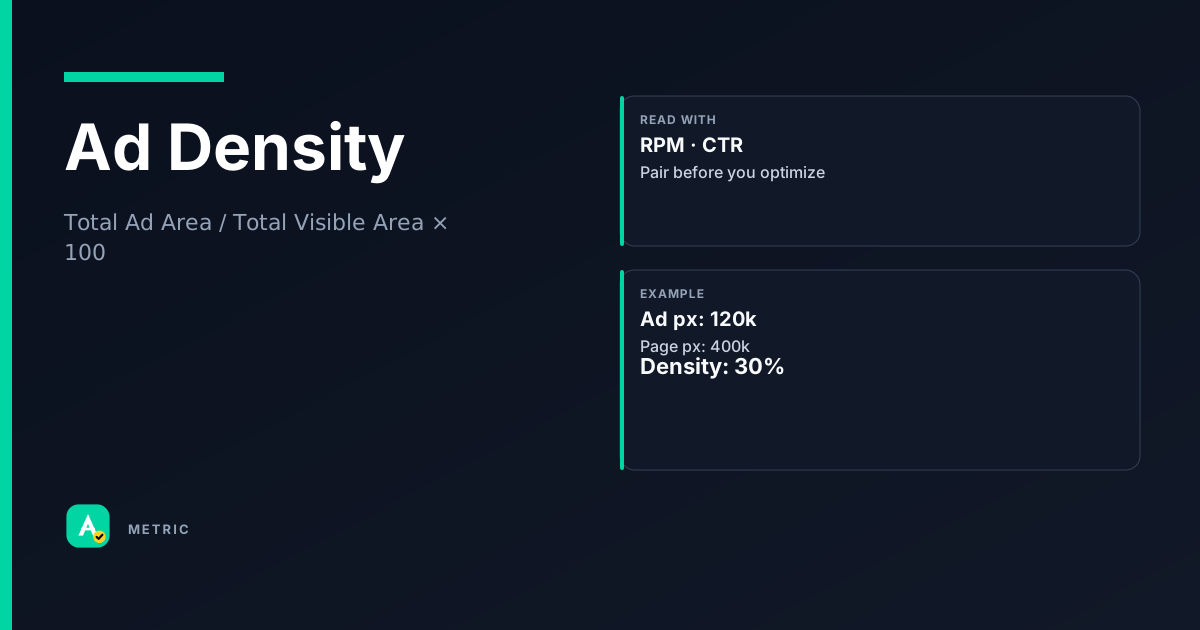
Ad Density measures the proportion of a page or screen area occupied by ads versus content. A high ad density can boost short-term RPM but often degrades user experience, viewability, and policy compliance. Publishers must balance fill rate and price against the risk of intrusive ad experiences.
What it is
Ad Density is the ratio of ad-occupied area to total visible area on a page or in-app screen. It is a UX signal, not a direct revenue metric — but it directly affects revenue through policy enforcement, viewability thresholds, and user engagement.
A common dashboard misread: a publisher sees RPM climb after adding more ad units and assumes the tradeoff is working. What they miss is that viewability and CTR often drop as density rises, and user session depth may shrink. The net effect on revenue can be flat or negative.
What it captures
- Ad-to-content ratio — how much of the screen is ad inventory vs. editorial or utility content.
- Policy risk — platforms like Google AdSense and Ad Manager have explicit UX guidelines; exceeding a reasonable density can trigger warnings or account suspension.
- User experience impact — high density correlates with higher bounce rates and lower return visits, especially on mobile.
So what: Ad Density is a governor on yield. Ignoring it in pursuit of RPM is the fastest way to lose both demand and audience.
How it is calculated
Ad Density = Total Ad Area / Total Visible Area × 100
Where:
- Total Ad Area = sum of the pixel dimensions (width × height) of all ad containers on the screen.
- Total Visible Area = the viewport or screen resolution dimensions (width × height).
Important caveats
- Viewport vs. page height — Most UX-focused definitions use the visible viewport, not the full document height. A page with 10 ad units below the fold may have low density at initial load.
- Ad container vs. creative — Some tools measure the container (including padding and borders), others measure the actual creative. Check your vendor’s definition.
- Dynamic density — On single-page apps or infinite scroll, density can change as the user scrolls. A snapshot at page load may not reflect the experience.
- Platform-specific policies — Google AdSense does not publish a hard numeric density limit, but their policies prohibit sites where "ads take up more content than the main content." IAB’s Better Ads Standards flag specific ad experiences (e.g., sticky ads taking >30% of viewport) as intrusive.
So what: Without a consistent measurement definition, comparing ad density across tools is unreliable. Standardize on viewport-based measurement.
How to read it in a dashboard
Ad Density is a contextual metric — a single number tells you little without pairing it with engagement and revenue data.
What to look for
- Above 50% on mobile — This is a red flag. The Better Ads Standards consider large sticky ads (>30% viewport) intrusive. Expect policy warnings and user drop-off.
- Below 15% on desktop — Likely safe for UX, but you may be leaving revenue on the table if demand exists for more placements.
- Rising density + flat or falling RPM — You are adding inventory that nobody wants to buy. The extra units are dragging down viewability and page quality.
Always pair with
- Viewability — High density can push ads into low-viewability zones (below the fold, in sidebars users ignore).
- CTR — If density rises and CTR falls, users are likely ignoring or avoiding the ad-heavy layout.
- RPM — The ultimate check: did the density increase actually grow total revenue per thousand sessions?
So what: Treat ad density as a diagnostic, not a KPI. A "good" density depends on your layout, device mix, and audience tolerance.
What usually moves this metric
Levers that increase density
- Adding more ad units — The most direct lever. More slots = higher density.
- Larger ad sizes — Replacing a 300×250 with a 300×600 increases density for that slot.
- Sticky / floating ads — These remain on screen while scrolling, effectively increasing density over time.
- Auto-refresh — If a slot reloads with a new creative, density doesn't change, but the perceived density can feel higher to users.
Levers that decrease density
- Removing low-performing slots — Cut units with low fill rates or CPMs; they contribute density without meaningful revenue.
- Using lazy loading — Ads load only when near the viewport, reducing initial density.
- Consolidating ad containers — Fewer, larger, well-placed units can maintain revenue at lower density.
- Ad refresh limits — Cap the number of refreshes per session to avoid density creep.
Tradeoffs
- Density vs. RPM — A home-services advertiser once added three extra 300×250 units to a recipe page. RPM rose 12% in week one, then viewability dropped from 68% to 41%, and CTR halved. Net RPM after two weeks was lower than before the change. The extra density cannibalized the performance of existing units.
- Density vs. Policy Compliance — Google Ad Manager’s policy on "excessive ads" is enforced via manual review and automated flagging. A density spike can trigger a warning with no appeal window.
So what: Optimize for revenue per session at acceptable density, not density itself. Test density changes with a holdout group and measure session-level RPM, not page-level RPM.
Formula
Most tools use viewport dimensions (not full page height) for Total Visible Area. Check your vendor’s definition.
Scenarios
The recipe site that lost its AdSense account
A food blog added three sticky ad units (top, mid-article, bottom) to increase RPM. Within two weeks, AdSense flagged the site for "excessive ads."
What happened: Ad density jumped from ~18% to ~55% on mobile. Users complained about the layout; session duration dropped 30%. What they did: Removed the sticky units, reverted to two static in-content ads. Density returned to 22%. RPM dropped 8%, but the account was reinstated. Takeaway: Policy compliance is non-negotiable. A short RPM gain is not worth losing your monetization platform.
The news publisher who cut density and grew revenue
A regional news site ran 8 ad units per article page. Density was 48% on desktop.
What happened: Viewability was 34%. Advertisers complained about low viewability and began lowering bids. What they did: Removed 3 low-CTR units, consolidated to 5 well-placed slots. Density dropped to 28%. Viewability rose to 62%. RPM increased 22% because each remaining unit had higher competition and better viewability. Takeaway: Fewer, better-placed ads can outperform a dense layout. Measure revenue per session, not ad count.
The e-commerce site that misread the dashboard
A home-goods retailer saw RPM climb 15% after adding a sidebar ad unit. The team celebrated.
What happened: They had not checked viewability or bounce rate. The sidebar unit had 8% viewability. Overall CTR dropped 20%. Bounce rate increased 5 percentage points. What they did: A/B tested the sidebar unit. Without it, overall revenue per session was higher because users engaged more with product pages. Takeaway: Always pair density changes with session-level revenue and engagement metrics. A rising RPM can hide a falling user experience.
Common pitfalls
Chasing RPM without watching density
Adding more ad units almost always increases RPM in the short term. The trap is that viewability and CTR degrade, and the net effect on revenue per user is often flat or negative.
What to do instead:
- Run a 2-week A/B test with a density cap vs. no cap.
- Measure revenue per session, not RPM.
- Monitor policy dashboard for warnings.
Assuming density is the same across devices
A page with 30% density on desktop may be 70% on mobile because the viewport is smaller. Publishers often optimize for desktop and get flagged on mobile.
What to do instead:
- Measure density separately for mobile, tablet, and desktop.
- Use responsive ad units that scale down on small screens.
- Test with mobile-first viewport sizes.
Treating density as a fixed number
Density changes with scroll position, lazy loading, and auto-refresh. A snapshot at page load may not reflect the user’s full experience.
What to do instead:
- Use a tool that measures density over the session (e.g., cumulative density).
- Set a maximum density threshold for any single viewport state.
- Review density distribution, not just the average.
Summary
Ad Density is a UX governor that directly impacts policy compliance, viewability, and long-term revenue. Treat it as a constraint, not a lever.
- Measure density per device and per viewport state, not as a single page average.
- Always pair density changes with session-level RPM and engagement metrics.
- Fewer, well-placed ads almost always outperform a dense layout in the long run.
Quick check
Confirm you understood this article.
boolean
Ad Density is a direct revenue metric like RPM.
Select an answer to continue
Related metrics
References
- Google AdSense Help Center — Ad placement policies (conceptual reference)
- Google Ad Manager Help — Policy on excessive ads and user experience (conceptual reference)
- IAB Tech Lab — Better Ads Standards for intrusive ad experiences (conceptual reference)
For learning only. Not advice on bids or spend.
You may also like
Metrics
Click-through rate (CTR)
Click-through rate (CTR) measures how often people click your ad after seeing it.
EngagementMetrics
Revenue per Mille (RPM)
RPM (Revenue per Mille) measures how much a publisher earns per thousand page views or sessions.
RevenueMetrics
Viewability (Visible Impression Rate)
Viewability measures whether an ad had a reasonable chance of being seen by a human.
QualityMetrics
Session RPM (Revenue Per Mille Sessions)
Session RPM (Revenue Per Mille Sessions) measures estimated earnings per thousand user sessions.
Revenue