#relationships·Jul 17, 2026·6 min read
Fill Rate vs RPM: Which Metric Tells You If Your Ad Inventory Is Actually Profitable?
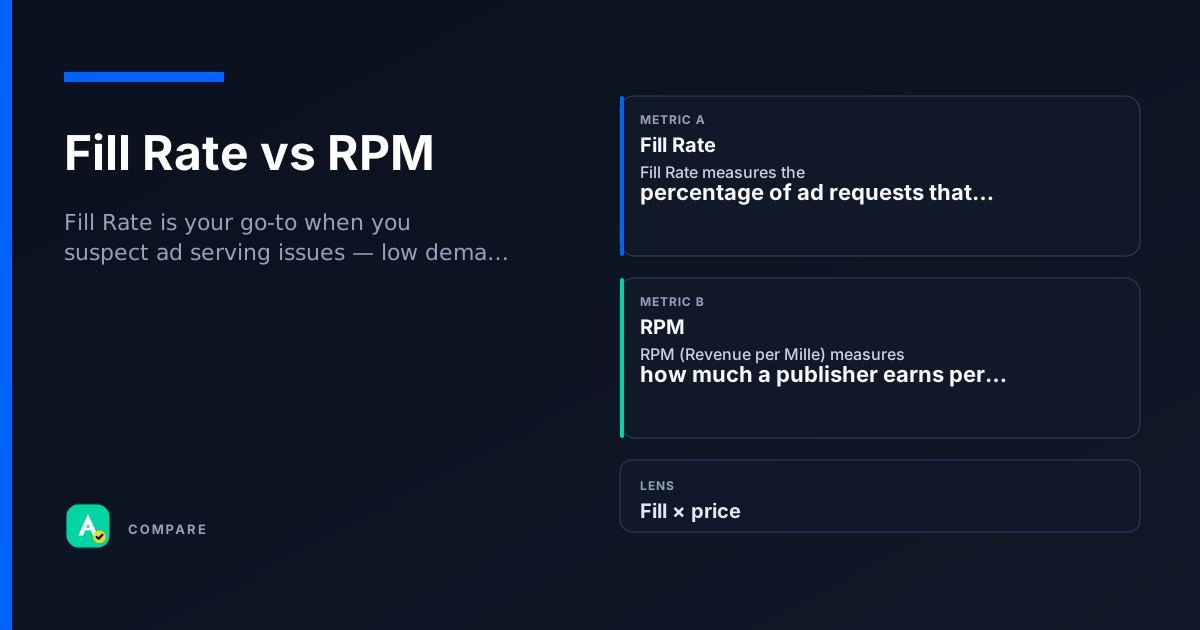
Fill Rate measures how often your ad slots are filled with an ad. RPM (Revenue Per Mille) measures how much revenue you earn per thousand ad opportunities. Both are essential, but they answer very different questions about your ad monetization.
Core Difference: Volume vs. Value
Fill Rate is about volume: what percentage of your ad requests actually return an ad. RPM is about value: how much revenue you generate per thousand ad opportunities.
- Fill Rate = (Ad Responses / Ad Requests) × 100%
- RPM = (Estimated Revenue / Ad Requests) × 1000
A high Fill Rate means your inventory is in demand, but it doesn't tell you if that demand is profitable. A high RPM means you're earning well per opportunity, but it could hide a low Fill Rate that leaves revenue on the table.
Which to Use When
Choose Fill Rate when:
- You're troubleshooting why ads aren't serving (e.g., low demand, timeout issues).
- You're optimizing ad placement or ad unit sizes.
- You're comparing different ad networks for fill reliability.
Choose RPM when:
- You're evaluating overall revenue performance.
- You're comparing monetization across different pages or traffic sources.
- You're reporting to stakeholders on revenue efficiency.
Use both when:
- You're diagnosing a revenue drop — low Fill Rate? Low RPM? Both?
- You're running A/B tests on ad layouts — track both to see if higher fill comes at a cost to RPM.
How they diverge
What They Measure
- Fill Rate: Percentage of ad requests that return an ad. Focuses on availability.
- RPM: Revenue per thousand ad opportunities. Focuses on monetary value.
How They React to Low Demand
- Fill Rate: Drops when demand is low — fewer requests get filled.
- RPM: Can stay high even with low demand if the few ads that serve are high-paying.
Impact of Ad Blockers
- Fill Rate: Drops significantly — ad requests are blocked before they reach the ad server.
- RPM: Drops even more — not only are impressions lost, but the remaining impressions may be lower value (e.g., public service ads).
Where they overlap
Same Denominator
Both metrics typically use ad requests as the denominator. This means they can be compared side-by-side without re-basing.
Both Are Aggregates
Neither metric tells you about individual ad slot performance. They are top-level health indicators that need deeper breakdowns (by placement, device, geo) to be actionable.
Both Are Reported in Standard Dashboards
Google Ad Manager, AdSense, and most SSPs report both metrics in the same interface, often in the same table.
Real scenarios
High Fill Rate, Low RPM — The Cheap Fill Trap
Setup: A publisher with 95% Fill Rate but RPM of $0.50.
- What happened: Almost every ad request gets filled, but mostly with low-paying remnant ads.
- What they checked: Fill Rate looked great, but RPM revealed the inventory was undervalued.
Takeaway: High Fill Rate can mask low revenue. Always pair it with RPM to see if the fill is profitable.
Low Fill Rate, High RPM — The Premium Scarcity
Setup: A niche site with 30% Fill Rate but RPM of $15.
- What happened: Only premium advertisers bid, so few requests get filled, but each impression earns a high CPM.
- What they checked: RPM looked great, but Fill Rate showed they were leaving money on the table from unfilled requests.
Takeaway: High RPM can hide missed revenue. Improving Fill Rate (e.g., adding a backfill network) could boost total revenue even if RPM drops slightly.
How they work together
Fill Rate is your go-to when you suspect ad serving issues — low demand, timeout errors, or ad blocker impact. It's also useful when comparing ad networks for fill reliability.
RPM is your primary metric for revenue performance — comparing monetization across pages, traffic sources, or time periods. It's the metric stakeholders care about most.
Use both when diagnosing a revenue change — a drop in RPM could be caused by lower Fill Rate, lower CPM, or both. Tracking both gives you the full picture.
Side-by-side snapshot
| Lens | Fill Rate | RPM |
|---|---|---|
| Definition | Percentage of ad requests that return an ad | Revenue per thousand ad opportunities |
| Formula | (Ad Responses / Ad Requests) × 100% | (Estimated Revenue / Ad Requests) × 1000 |
| Primary Use | Diagnose ad serving issues | Evaluate revenue efficiency |
| Impact of Ad Blockers | Drops significantly | Drops even more (lower CPM on remaining ads) |
| Typical Range | 60%–95% for most publishers | Varies wildly by format and niche |
| Optimization Goal | Maximize without sacrificing RPM | Maximize without sacrificing user experience |
Common pitfalls
Optimizing Fill Rate Alone Can Lower Revenue
Why the confusion is wrong: Chasing 100% Fill Rate often means accepting very low CPM ads, which can actually lower RPM.
- What to do instead: Set a floor price or use price floors in your ad server to avoid filling with worthless ads. Monitor both Fill Rate and RPM together.
Comparing RPM Across Different Inventory Types
Why the confusion is wrong: RPM from video ads and display ads are not comparable — video typically has much higher RPM but also lower Fill Rate.
- What to do instead: Segment RPM by ad format (display, video, native) before comparing. Use Fill Rate to understand the context of the RPM number.
Quick check
Test whether you can tell these metrics apart.
boolean
A high Fill Rate always means high revenue.
Select an answer to continue
For learning only. Not advice on bids or spend.
You may also like
Metrics
Fill Rate
Fill Rate measures the percentage of ad requests that result in a served ad.
SupplyMetrics
Revenue per Mille (RPM)
RPM (Revenue per Mille) measures how much a publisher earns per thousand page views or sessions.
RevenueRelationships
AOV vs CAC
RelationshipsRelationships
Impression vs Reach
Relationships