#relationships·Jul 17, 2026·6 min read
AOV vs CAC: Which Metric Tells You If Your Ads Are Actually Profitable?
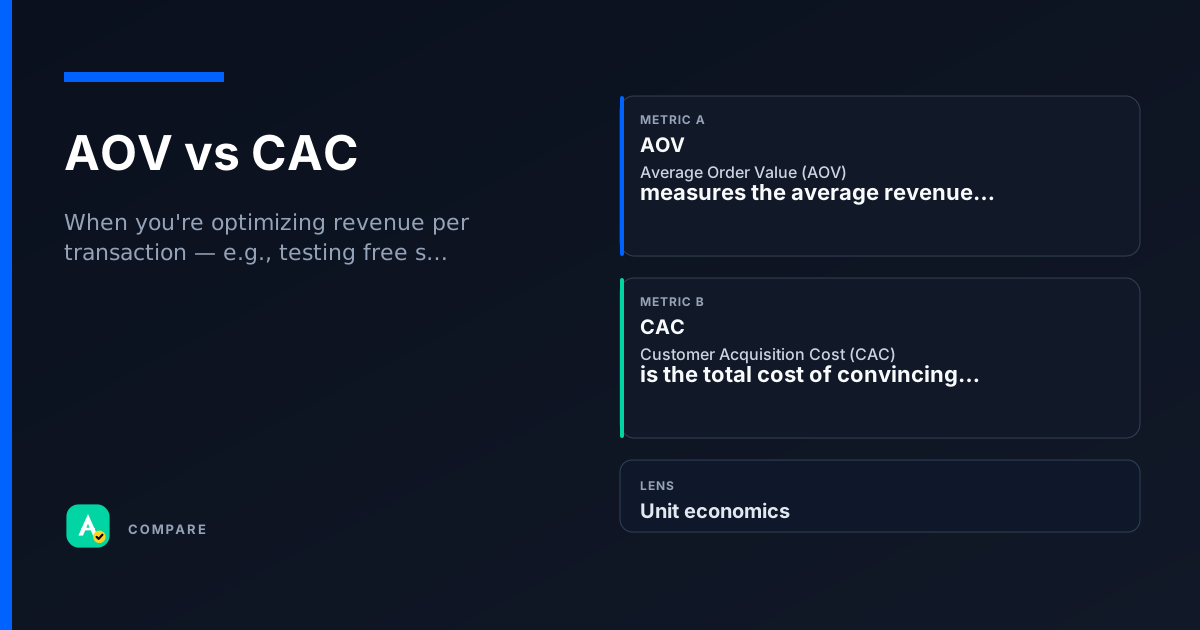
AOV (Average Order Value) measures how much a customer spends per purchase. CAC (Customer Acquisition Cost) measures how much you spend to get that customer. Together they answer: Are we making more per order than it costs to get the order?
Core Difference: Revenue per Order vs Cost per Customer
AOV is a revenue metric: total revenue / number of orders. It tells you the average basket size.
CAC is a cost metric: total marketing spend / number of new customers acquired. It tells you the efficiency of your acquisition engine.
Why they're often confused
- Both are per-unit averages (per order, per customer).
- Both can be improved by targeting higher-value segments.
- But they move in opposite directions when you scale: AOV often drops (more low-ticket buyers), CAC often rises (more expensive channels).
The profitability check
- If AOV < CAC, you lose money on every order (unless you have strong repeat purchase rates).
- If AOV > CAC, you have a positive unit economics — but still need to account for COGS, shipping, returns.
Which to Use When
Use AOV when:
- You want to optimize upsells, cross-sells, or minimum order thresholds.
- You're comparing product bundles or pricing tiers.
- You're analyzing checkout funnel performance (e.g., abandoned cart recovery).
Use CAC when:
- You want to evaluate channel efficiency (e.g., Facebook vs Google vs affiliates).
- You're deciding budget allocation across campaigns.
- You're calculating payback period or LTV:CAC ratio.
Use both when:
- You're assessing overall campaign profitability.
- You're building a unit economics dashboard (AOV - COGS - CAC = gross profit per customer).
How they diverge
What They Measure
- AOV: Revenue per order (top-line).
- CAC: Cost per customer (bottom-line).
How They're Calculated
- AOV: Total revenue / Number of orders.
- CAC: Total marketing spend / Number of new customers.
What They Tell You
- AOV: How much customers are willing to spend in one transaction.
- CAC: How efficiently you're acquiring new customers.
Where they overlap
Both Are Per-Unit Averages
Both divide a total (revenue or spend) by a count (orders or customers). This makes them sensitive to outliers and segment mix.
Both Can Be Optimized via Targeting
Better audience targeting can raise AOV (higher-intent buyers) and lower CAC (cheaper to convert).
Both Are Used in Unit Economics
AOV and CAC are the two pillars of the basic profitability check: AOV must exceed CAC (after COGS) for a campaign to be sustainable.
Real scenarios
The High-AOV, High-CAC Trap
A DTC brand runs Facebook ads that generate $120 AOV but $110 CAC. On paper, the campaign is profitable by $10 per order.
- What happened: After accounting for COGS ($50) and returns (10%), the true profit per order was ($120 - $12 return - $50 COGS) - $110 CAC = -$52.
- What they checked: They only looked at AOV vs CAC, ignoring COGS and returns.
Takeaway: AOV > CAC is necessary but not sufficient. Always subtract COGS, shipping, and returns before declaring profitability.
The Low-AOV, Low-CAC Win
A subscription brand offers a $10 trial box. CAC is $8. AOV is low, but the LTV is $300 over 12 months.
- What happened: The first order loses $8, but the customer pays $25/month for a year.
- What they checked: They used AOV and CAC only for first-order economics, then relied on LTV:CAC for the full picture.
Takeaway: For subscription or repeat-purchase models, AOV and CAC are only useful for the first transaction. Always pair with LTV.
How they work together
When you're optimizing revenue per transaction — e.g., testing free shipping thresholds, product bundles, or upsell flows.
When you're optimizing acquisition efficiency — e.g., comparing ad platforms, testing creative, or setting bid strategies.
When you're evaluating campaign profitability — e.g., calculating gross profit per customer: (AOV - COGS) - CAC.
Side-by-side snapshot
| Lens | AOV | CAC |
|---|---|---|
| Definition | Revenue per order | Cost per new customer |
| Formula | Total revenue / Number of orders | Total marketing spend / Number of new customers |
| Optimization lever | Upsells, bundles, minimum order thresholds | Channel mix, creative, targeting, bid strategy |
| Time horizon | Per transaction (short-term) | Per customer (medium-term) |
| Common pitfall | Ignoring that high AOV can increase CAC | Ignoring that low CAC can come from low-quality customers |
Common pitfalls
Confusing AOV and CAC as Profitability Metrics
It's tempting to think AOV - CAC = profit. But that ignores COGS, shipping, returns, payment fees, and overhead.
- What to do instead: Build a full unit economics model: (AOV - COGS - shipping - returns - payment fees) - CAC = gross profit per customer.
Optimizing AOV Without Considering CAC
Raising AOV by requiring a $50 minimum order can increase revenue per order, but it may also increase CAC because fewer customers qualify.
- What to do instead: Test AOV thresholds and measure the impact on CAC simultaneously. Use a blended metric like revenue per visitor (RPV).
Quick check
Test whether you can tell these metrics apart.
boolean
AOV and CAC together can tell you if a campaign is profitable without considering COGS.
Select an answer to continue
For learning only. Not advice on bids or spend.
You may also like
Metrics
Average Order Value (AOV)
Average Order Value (AOV) measures the average revenue generated per order placed.
ValueMetrics
Customer Acquisition Cost (CAC)
Customer Acquisition Cost (CAC) is the total cost of convincing a prospect to become a paying c…
ValueRelationships
CPA vs LTV
RelationshipsRelationships
Auction Latency vs Win Rate
Relationships