#relationships·Jul 17, 2026·6 min read
Fill Rate vs eCPM: Which Metric Tells You If Your Ad Inventory Is Actually Profitable?
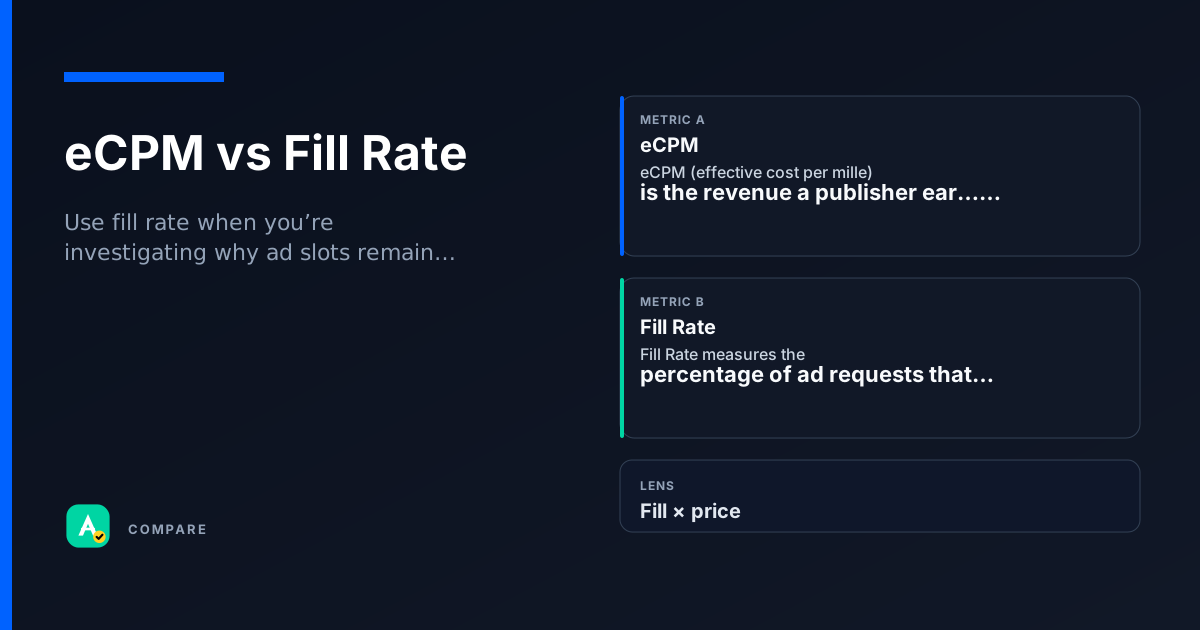
Fill rate measures how often your ad slots get filled. eCPM measures how much revenue you earn per thousand impressions. One tells you about inventory utilization; the other tells you about revenue efficiency.
Core Difference: Utilization vs Revenue per Impression
Fill rate = (filled impressions / total ad requests) × 100%. It shows how much of your inventory is actually sold.
eCPM = (total revenue / total impressions) × 1000. It shows how much money you make for every thousand impressions served, regardless of fill rate.
- Fill rate answers: Are we selling our available ad space?
- eCPM answers: Are we selling it at a good price?
Which to Use When
Pick fill rate when:
- You’re diagnosing why ad slots remain empty.
- You’re testing a new ad placement or format.
- You want to check header bidding or waterfall efficiency.
Pick eCPM when:
- You’re comparing revenue across different ad networks.
- You’re optimizing ad pricing or floor prices.
- You’re reporting monetization performance to stakeholders.
Use both when:
- You’re doing a full inventory health check.
- You’re deciding whether to increase ad load or change ad partners.
How they diverge
What They Measure
Fill rate measures the percentage of ad requests that return an ad. eCPM measures the revenue earned per thousand impressions.
- Fill rate: inventory utilization (quantity of sold slots).
- eCPM: revenue efficiency (quality of sold slots).
How They Are Calculated
Fill rate = (filled impressions / total ad requests) × 100. eCPM = (total revenue / total impressions) × 1000.
- Fill rate uses ad requests as denominator.
- eCPM uses impressions as denominator.
- Fill rate is a percentage; eCPM is a currency amount.
What They Tell You About Your Inventory
Fill rate reveals demand sufficiency — whether there are enough buyers for your slots. eCPM reveals pricing power — how much buyers are willing to pay.
- High fill rate + low eCPM = lots of cheap ads.
- Low fill rate + high eCPM = premium but unsold inventory.
- Both high = healthy monetization.
Where they overlap
Both Are Ratios
Both metrics normalize raw counts (impressions, requests) into a ratio, making them comparable across different time periods or ad units.
Both Are Used for Optimization
Publishers use both to tune ad operations — fill rate for demand management, eCPM for pricing strategy. They are often reviewed in the same dashboard.
Both Can Be Misleading in Isolation
A high fill rate can hide low eCPM; a high eCPM can hide low fill rate. Neither metric alone gives a complete picture of monetization health.
Real scenarios
High Fill Rate, Low eCPM: The Cheap Inventory Trap
A publisher sees 95% fill rate but eCPM of $0.20.
- What happened: Ads are filling with low-paying remnant demand.
- What they checked: Fill rate looked great, but eCPM revealed poor revenue quality.
Takeaway: Don’t celebrate high fill rate without checking eCPM. Optimize for revenue, not just utilization.
Low Fill Rate, High eCPM: The Premium Ghost Town
A publisher has eCPM of $8.00 but fill rate of 30%.
- What happened: Inventory is valuable but undersold — maybe floor prices are too high or demand is limited.
- What they checked: eCPM looked great, but fill rate showed most slots go empty.
Takeaway: High eCPM can hide lost revenue from unsold inventory. Lower floor prices or expand demand to increase fill.
How they work together
Use fill rate when you’re investigating why ad slots remain empty — for example, after changing ad tags or adding new placements. It’s also key for header bidding diagnostics.
Use eCPM when you’re comparing ad networks or pricing strategies. It’s the standard metric for revenue benchmarking and floor price optimization.
Use both when you’re doing a full inventory audit or deciding whether to increase ad load. Together they reveal if you’re selling enough slots at a good enough price.
Side-by-side snapshot
| Lens | eCPM | Fill Rate |
|---|---|---|
| Definition | Percentage of ad requests that result in a served ad. | Revenue earned per thousand impressions. |
| Formula | (filled impressions / total ad requests) × 100 | (total revenue / total impressions) × 1000 |
| Primary Insight | Inventory utilization (are slots being sold?) | Revenue efficiency (are slots sold at a good price?) |
| Best For | Diagnosing empty slots, testing ad placements. | Comparing networks, setting floor prices, reporting revenue. |
| Common Misuse | Assuming high fill rate means high revenue. | Comparing eCPM across different formats without segmentation. |
Common pitfalls
Confusing Fill Rate with Viewability or Click-Through Rate
Fill rate only tells you if an ad was served, not if it was seen or clicked.
- What to do instead: Use viewability rate for visibility and CTR for engagement. Don’t assume fill rate equals performance.
Using eCPM to Compare Across Different Ad Formats
eCPM varies wildly by format (video vs display vs native). Comparing them directly can mislead.
- What to do instead: Segment eCPM by format before comparing. Use revenue per user for cross-format analysis.
Quick check
Test whether you can tell these metrics apart.
single
Which metric measures the percentage of ad requests that actually serve an ad?
Select an answer to continue
For learning only. Not advice on bids or spend.
You may also like
Metrics
Effective Cost Per Mille (eCPM)
eCPM (effective cost per mille) is the revenue a publisher earns per thousand ad impressions, r…
RevenueMetrics
Fill Rate
Fill Rate measures the percentage of ad requests that result in a served ad.
SupplyRelationships
CPI vs ROAS
RelationshipsRelationships
AOV vs CVR
Relationships