#relationships·Jul 17, 2026·6 min read
AOV vs CVR: Which Metric Drives More Revenue for Your Campaigns?
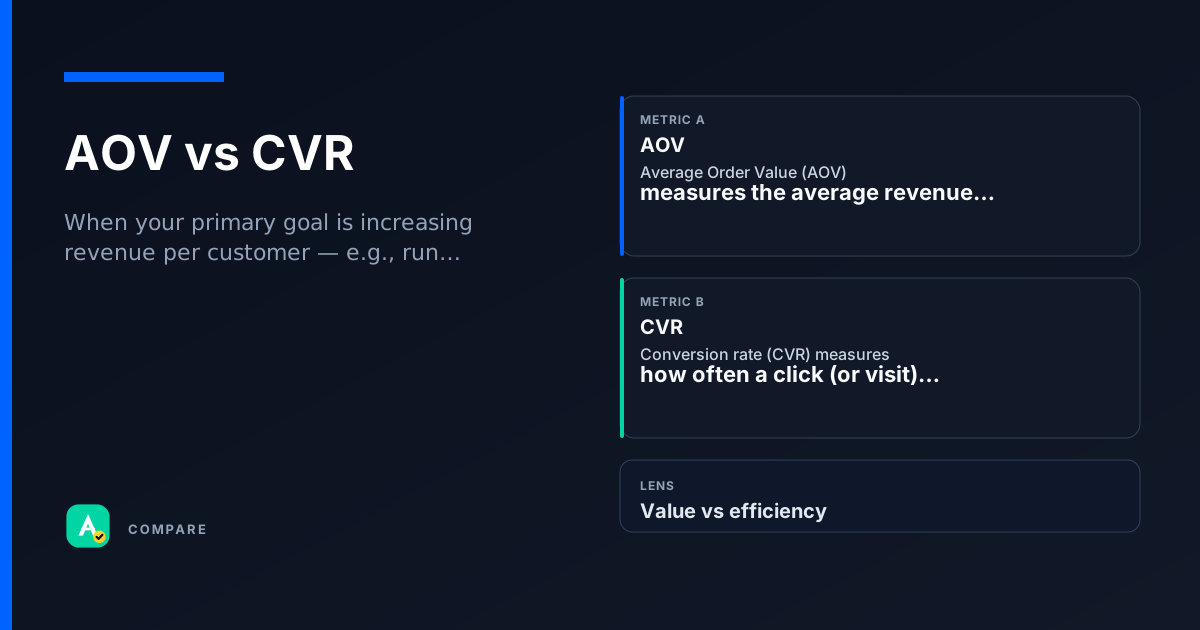
AOV (Average Order Value) tells you how much a customer spends per transaction. CVR (Conversion Rate) tells you how many visitors complete a desired action. Together, they answer: Should I focus on getting more people to buy, or getting each buyer to spend more?
Core Difference: Value per Transaction vs. Rate of Conversion
AOV = Total Revenue / Number of Orders. It measures the average basket size.
CVR = Number of Conversions / Total Visitors × 100%. It measures the efficiency of your funnel.
Key contrast
- AOV is about depth — how much each buyer spends.
- CVR is about breadth — how many visitors become buyers.
Why it matters
- A high AOV with low CVR means you have a few big spenders but a leaky funnel.
- A high CVR with low AOV means many small transactions — volume over value.
So what: Optimizing one without the other can mislead your revenue strategy.
Which to Use When
Pick AOV when:
- You run upsell/cross-sell campaigns.
- Your goal is to increase revenue per customer.
- You have a loyalty program or tiered pricing.
Pick CVR when:
- You run awareness or prospecting campaigns.
- Your goal is to grow your customer base.
- You are testing landing pages, ad copy, or checkout flow.
Use both when:
- You are forecasting revenue or ROI.
- You are comparing campaign performance across different funnels.
- You want to diagnose why revenue changed (e.g., CVR dropped but AOV stayed flat).
How they diverge
What They Measure
- AOV: Monetary value per completed order.
- CVR: Percentage of visitors who convert (any action: purchase, sign-up, etc.).
How They Are Calculated
- AOV: Total Revenue / Number of Orders.
- CVR: (Conversions / Total Visitors) × 100%.
Optimization Levers
- AOV: Product bundling, minimum spend thresholds, upsell offers.
- CVR: Ad relevance, landing page speed, checkout friction reduction.
Where they overlap
Both Are Conversion Metrics
Both require a conversion event (order, lead, sign-up) to be tracked. Neither works without a defined conversion action.
Both Impact Revenue
Revenue = Visitors × CVR × AOV. A change in either metric directly changes total revenue.
Both Are Segmentable
You can calculate AOV and CVR by traffic source, device, campaign, or audience segment for granular analysis.
Real scenarios
The Upsell Campaign That Boosted AOV but Hurt CVR
Setup: An e-commerce brand added a "spend $50 for free shipping" pop-up.
- What happened: AOV jumped 20%, but CVR dropped 12% — many visitors abandoned the cart.
- What they checked: They segmented by device and found mobile users were most affected.
Takeaway: Raising AOV can suppress CVR if the threshold feels punitive. Test thresholds and offer alternatives (e.g., "add one more item" vs. "spend $X more").
The Landing Page Test That Raised CVR but Lowered AOV
Setup: A SaaS company tested a simplified landing page with a single low-price plan.
- What happened: CVR increased 30%, but AOV dropped 25% — users chose the cheapest option.
- What they checked: They compared revenue per visitor (RPV = CVR × AOV) and found it was flat.
Takeaway: A higher CVR doesn't always mean higher revenue. Always check RPV when optimizing one metric in isolation.
How they work together
When your primary goal is increasing revenue per customer — e.g., running upsell campaigns, loyalty programs, or subscription tiers.
When your primary goal is growing your customer base — e.g., prospecting campaigns, A/B testing landing pages, or reducing checkout friction.
When you need a complete revenue picture — e.g., forecasting ROI, diagnosing a revenue drop, or comparing campaign efficiency across funnels.
Side-by-side snapshot
| Lens | AOV | CVR |
|---|---|---|
| Definition | Average revenue per completed order | Percentage of visitors who convert |
| Formula | Total Revenue / Orders | (Conversions / Visitors) × 100% |
| Optimization Focus | Increase basket size (upsells, bundles, thresholds) | Increase conversion rate (relevance, UX, checkout flow) |
| Typical Use Case | Loyalty programs, subscription tiers, cross-sell campaigns | Prospecting campaigns, landing page A/B tests, funnel optimization |
| Risk When Over-Optimized | CVR may drop if thresholds feel punitive | AOV may drop if discounts or low-price offers dominate |
Common pitfalls
Optimizing AOV Without Considering CVR
Raising minimum order thresholds or adding expensive upsells can scare away price-sensitive buyers.
- What to do instead: Run A/B tests with small threshold increments and monitor CVR closely. Use RPV as your north star.
Optimizing CVR Without Considering AOV
Discounting heavily or promoting low-priced items can inflate CVR while shrinking AOV.
- What to do instead: Track revenue per visitor (RPV) alongside CVR. If CVR goes up but RPV stays flat or drops, you may be trading value for volume.
Quick check
Test whether you can tell these metrics apart.
boolean
AOV measures how many visitors complete a purchase.
Select an answer to continue
For learning only. Not advice on bids or spend.
You may also like
Metrics
Average Order Value (AOV)
Average Order Value (AOV) measures the average revenue generated per order placed.
ValueMetrics
Conversion Rate (CVR)
Conversion rate (CVR) measures how often a click (or visit) leads to a desired action — a purch…
PerformanceRelationships
eCPM vs RPM
RelationshipsRelationships
CPA vs ROI
Relationships