#relationships·Jul 17, 2026·6 min read
ROAS vs ROI: Which Ad Metric Tells You More?
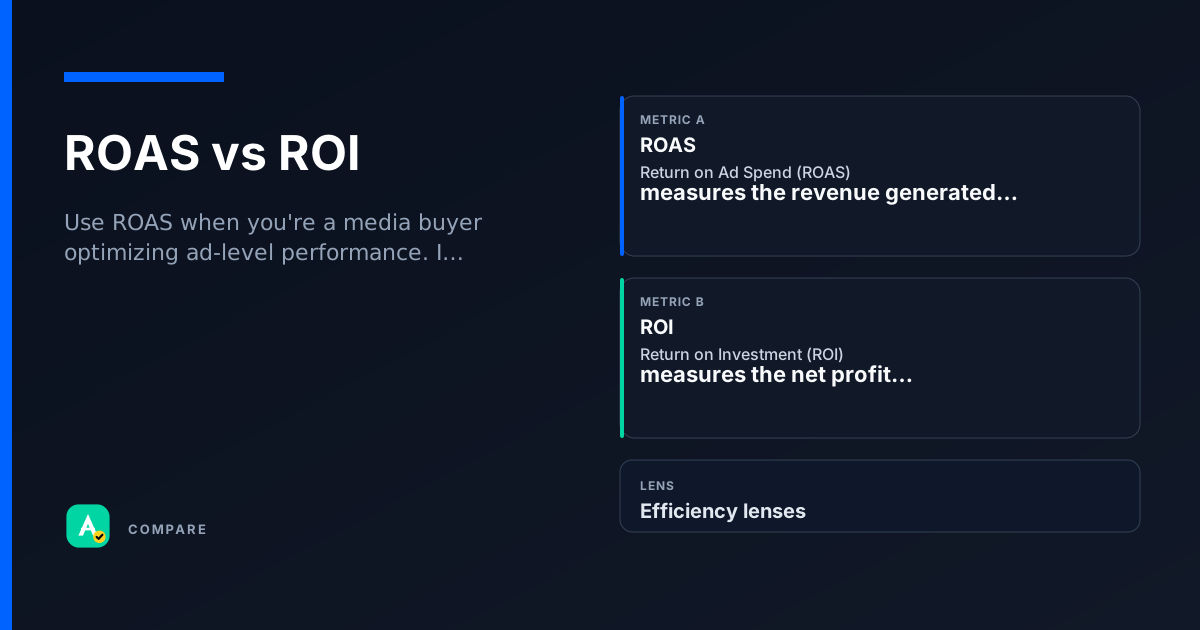
ROAS (Return on Ad Spend) and ROI (Return on Investment) both measure campaign profitability, but they answer different questions. ROAS focuses purely on ad revenue vs. ad cost, while ROI factors in all costs to show true profit.
Core Difference: Revenue vs. Profit
ROAS = Revenue from ads / Ad spend. It tells you how many dollars you earned for every dollar spent on ads. A ROAS of 4 means $4 earned per $1 spent.
ROI = (Net profit / Total investment) × 100%. It subtracts all costs (ad spend, agency fees, software, fulfillment) to show the percentage return on your total outlay.
Key distinction
- ROAS is a narrow, top-of-funnel efficiency ratio.
- ROI is a broad, bottom-line profitability metric.
Example: You spend $1,000 on ads, earn $4,000 in revenue. ROAS = 4. But after product costs ($2,000) and fees ($500), net profit = $500. ROI = ($500 / $3,500) × 100% ≈ 14.3%.
Which to use when
Pick ROAS when:
- You're optimizing individual ad sets or keywords.
- You need a quick, campaign-level efficiency check.
- Your costs beyond ad spend are stable or irrelevant to the decision.
Pick ROI when:
- You're evaluating overall business profitability.
- You need to compare ad campaigns against other investments (e.g., R&D, hiring).
- Your product margins vary significantly between campaigns.
Use both together for a complete picture: ROAS for tactical optimization, ROI for strategic decisions.
How they diverge
Formula & Scope
ROAS = Revenue / Ad spend. Only considers ad costs.
ROI = (Net profit / Total investment) × 100%. Includes all costs (ads, production, shipping, overhead).
- ROAS is a ratio (e.g., 4:1). ROI is a percentage (e.g., 14.3%).
What It Tells You
ROAS → "How efficient is my ad spend at generating revenue?"
ROI → "How profitable is this campaign after all expenses?"
- ROAS can be high while ROI is negative (if margins are thin).
- ROI can be positive even with a low ROAS (if margins are fat).
Typical Use Case
ROAS → Day-to-day campaign optimization, A/B testing ad creative, bidding strategy.
ROI → Budget allocation across channels, comparing marketing vs. other business investments, reporting to executives.
Where they overlap
Both measure return
Both quantify the financial return generated by marketing spend, helping marketers justify budgets and optimize performance.
Both need accurate data
Both rely on proper conversion tracking and attribution. Garbage in = garbage out for both metrics.
Both are relative
Neither has a universal "good" number. A good ROAS or ROI depends on your industry, margins, and business model.
Real scenarios
High ROAS, Negative ROI
Setup: An e-commerce store runs a Facebook campaign. Ad spend = $2,000. Revenue = $10,000. ROAS = 5.
- What happened: Product cost = $7,000, shipping = $1,000, fees = $500. Total cost = $10,500. Net profit = -$500. ROI = -4.8%.
- What they checked: ROAS looked great, but the product margin was too thin.
Takeaway: ROAS alone can hide unprofitable campaigns. Always pair with ROI when margins are tight.
Low ROAS, Positive ROI
Setup: A SaaS company runs LinkedIn ads. Ad spend = $5,000. Revenue from new subscriptions = $8,000. ROAS = 1.6.
- What happened: Customer acquisition cost (CAC) is $5,000, but average customer LTV = $25,000. Net profit after ad spend and overhead = $15,000. ROI = 300%.
- What they checked: ROAS looked low, but the high LTV made the campaign very profitable.
Takeaway: For subscription models, ROI (or ROAS adjusted for LTV) is more meaningful than raw ROAS.
How they work together
Use ROAS when you're a media buyer optimizing ad-level performance. It's the go-to for daily bid adjustments, creative testing, and audience segmentation.
Use ROI when you're a marketing director or CFO evaluating overall campaign profitability. It's essential for comparing marketing to other investments.
Use both in a dashboard: ROAS for tactical alerts (e.g., "this ad set dropped below 3x"), ROI for strategic reviews (e.g., "Q3 campaign generated 20% ROI").
Side-by-side snapshot
| Lens | ROAS | ROI |
|---|---|---|
| Formula | Revenue / Ad spend | (Net profit / Total investment) × 100% |
| Includes non-ad costs? | No | Yes |
| Output format | Ratio (e.g., 4:1) | Percentage (e.g., 14.3%) |
| Best for | Day-to-day ad optimization | Strategic profitability analysis |
| Common target | 4:1 or higher (varies by industry) | Positive % (varies by cost of capital) |
Common pitfalls
Confusing ROAS with ROI
Why the confusion is wrong: Many marketers say "ROI" when they mean "ROAS," leading to miscommunication with finance teams.
- What to do instead: Always specify which metric you're using. In reports, label clearly: "Ad-level ROAS" vs. "Campaign ROI (all costs)."
Using ROAS for strategic decisions
Why the confusion is wrong: ROAS ignores non-ad costs. A campaign with ROAS 10 could still lose money if margins are razor-thin.
- What to do instead: Use ROI for budget allocation across channels. Reserve ROAS for tactical ad optimization.
Quick check
Test whether you can tell these metrics apart.
single
Which metric includes product costs, shipping, and fees?
Select an answer to continue
For learning only. Not advice on bids or spend.
You may also like
Metrics
Return on Ad Spend (ROAS)
Return on Ad Spend (ROAS) measures the revenue generated for every dollar spent on advertising.
PerformanceMetrics
Return on Investment (ROI)
Return on Investment (ROI) measures the net profit generated by an advertising campaign relativ…
PerformanceRelationships
CPC vs CTR
RelationshipsRelationships
CTR vs Impression
Relationships