#relationships·Jul 17, 2026·6 min read
Reach vs Frequency: When to Prioritize Each in Ad-Tech
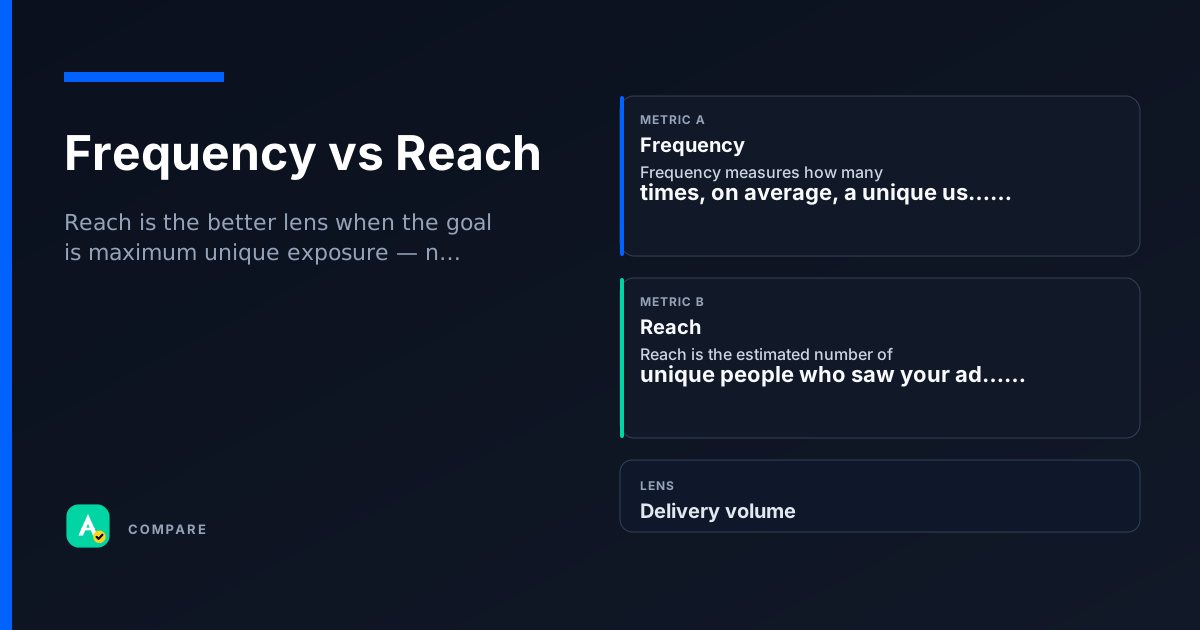
Reach counts the unique people who see your ad. Frequency counts how many times each person sees it. Together they define campaign exposure.
Core difference
Reach = unique individuals exposed. Frequency = average exposures per individual.
- Reach answers: How many different people did we touch?
- Frequency answers: How often did we touch them?
Formula
- Reach = Unique cookies / device IDs
- Frequency = Total impressions / Reach
Why it matters
High reach with low frequency = broad awareness, thin repetition. Low reach with high frequency = narrow audience, heavy repetition (risk of ad fatigue).
Which to use when
Pick Reach when:
- Launching a new product or brand awareness campaign.
- Goal is maximum unique eyeballs (e.g., Super Bowl ad).
- Budget is limited — you want breadth over depth.
Pick Frequency when:
- Running a retargeting or sequential-message campaign.
- You need to ensure message retention (e.g., 3+ exposures).
- You suspect ad fatigue or waste (frequency > 5-7 can cause negative ROI).
Use both together to calculate GRP (Gross Rating Points = Reach % × Frequency) for TV-like planning.
How they diverge
Definition
Reach: Unique individuals exposed. Frequency: Average exposures per individual.
- Reach = denominator in frequency formula.
- Frequency = total impressions / reach.
Primary use case
Reach: Brand awareness, audience expansion. Frequency: Message retention, retargeting.
- Reach optimizes for breadth.
- Frequency optimizes for depth.
Risk when overused
Reach: Too broad = wasted impressions on uninterested users. Frequency: Too high = ad fatigue, negative brand perception.
- Reach waste = low relevance.
- Frequency waste = annoyance.
Where they overlap
Both are impression-based
Both metrics start from the same raw data: ad impressions. Neither requires clicks or conversions.
Both depend on identity
Accurate reach and frequency require consistent user identification across devices and sessions (cookies, device IDs, logins).
Both are used in planning
Media planners combine reach and frequency to calculate GRP (Reach % × Frequency) for campaign budgeting.
Real scenarios
Brand awareness campaign
Setup: A CPG brand launches a new snack. Budget is $500k for 4 weeks.
- What happened: They optimized for reach only, hitting 80% of target audience with frequency of 1.2.
- What they checked: Unique reach across all devices.
Takeaway: High reach with low frequency works for simple awareness. No need for repetition if the message is clear.
Retargeting campaign
Setup: An e-commerce site retargets cart abandoners. Budget is $100k for 2 weeks.
- What happened: They set frequency cap at 5 per user. Average frequency was 3.8. Conversion rate was 12%.
- What they checked: Frequency distribution and conversion by exposure count.
Takeaway: Frequency matters for retargeting — too few exposures = no recall, too many = annoyance.
How they work together
Reach is the better lens when the goal is maximum unique exposure — new product launch, brand awareness, or political campaigns. Use it to answer: How many different people did we reach?
Frequency is the better lens when the goal is message repetition — retargeting, sequential storytelling, or driving recall. Use it to answer: How often did we reach them?
Use both when you need to balance breadth and depth — e.g., a campaign with a target GRP. Monitor frequency cap (e.g., 3-5 per user per week) while maximizing reach.
Side-by-side snapshot
| Lens | Frequency | Reach |
|---|---|---|
| What it measures | Unique individuals exposed | Average exposures per individual |
| Formula | Unique cookies / device IDs | Total impressions / Reach |
| Optimization goal | Maximize breadth | Maximize depth (with cap) |
| Risk | Wasted impressions on uninterested users | Ad fatigue and negative brand perception |
| Typical use case | Brand awareness, new product launch | Retargeting, sequential messaging |
Common pitfalls
Confusing reach with unique reach
Why the confusion is wrong: Some platforms report "reach" as total impressions (wrong).
- What to do instead: Always verify the metric definition. In Google Ads, reach = unique users. In Meta, reach = accounts reached. Cross-check with your ad server.
Ignoring frequency distribution
Why the confusion is wrong: Average frequency hides outliers — some users see the ad 20 times while others see it once.
- What to do instead: Look at frequency distribution (e.g., % of users with 1, 2, 3+ exposures). Set frequency caps in your DSP.
Quick check
Test whether you can tell these metrics apart.
single
Which metric counts unique individuals?
Select an answer to continue
For learning only. Not advice on bids or spend.
You may also like
Metrics
Frequency (Average Frequency)
Frequency measures how many times, on average, a unique user saw your ad during a campaign peri…
DeliveryMetrics
Reach (Unique Reach)
Reach is the estimated number of unique people who saw your ad at least once during a reporting…
DeliveryRelationships
ROAS vs ROI
RelationshipsRelationships
CPC vs CPM
Relationships