#relationships·Jul 17, 2026·6 min read
AOV vs CPA: Which Metric Should You Optimize for Profit?
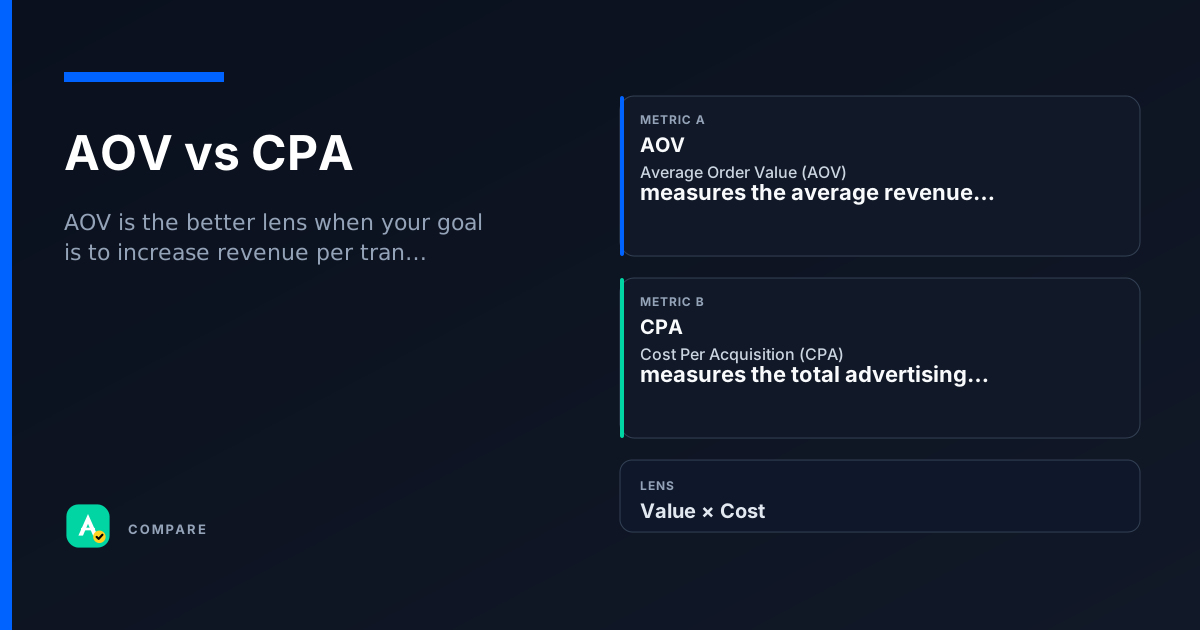
AOV (Average Order Value) measures the average revenue per purchase. CPA (Cost Per Acquisition) measures the cost to acquire a customer. Together they answer: Are we spending too much to earn too little?
Core Difference: Revenue vs Cost
AOV is a revenue metric. CPA is a cost metric.
- AOV = Total Revenue / Number of Orders
- CPA = Total Ad Spend / Number of Conversions
AOV tells you how much each buyer spends. CPA tells you how much you paid to get them. They live on opposite sides of the profit equation.
Why it matters
- High AOV + low CPA = healthy margin
- Low AOV + high CPA = you're losing money per customer
Which to Use When
Pick AOV when:
- You're optimizing product bundling or upsell strategies
- You're comparing revenue per customer across segments
- Your goal is to increase basket size
Pick CPA when:
- You're managing ad budget efficiency
- You're evaluating channel profitability (e.g., Facebook vs Google)
- Your goal is to lower customer acquisition cost
Use both when:
- You need profit per customer = AOV – CPA
- You're deciding whether to scale a campaign (AOV must exceed CPA)
How they diverge
What They Measure
AOV measures revenue per order. CPA measures cost per conversion.
- AOV = Total Revenue / Orders
- CPA = Total Ad Spend / Conversions
Optimization Direction
AOV you want to increase. CPA you want to decrease.
- Higher AOV = more revenue per sale
- Lower CPA = cheaper to acquire a customer
Impact on Profit
AOV directly boosts margin. CPA directly reduces margin.
- AOV ↑ → profit ↑ (if costs stay flat)
- CPA ↑ → profit ↓ (if revenue stays flat)
Where they overlap
Both Are Averages
Both AOV and CPA are calculated as totals divided by counts. They smooth out individual variation to give a campaign-level view.
Both Are Segmentable
You can break both down by channel, campaign, device, or audience. Segmenting reveals hidden winners and losers.
Both Are Lagging
Neither predicts future behavior. They reflect what already happened. Use them for diagnosis, not forecasting.
Real scenarios
The Upsell Experiment
An e‑commerce brand tested a post‑purchase upsell widget.
- What happened: AOV rose 18% but CPA stayed flat.
- What they checked: They compared AOV before/after the test and monitored CPA to ensure acquisition cost didn't spike.
Takeaway: Raising AOV without increasing CPA is a pure profit gain.
The Aggressive Bid Strategy
A DTC brand raised bids to capture more traffic.
- What happened: CPA doubled, but AOV only grew 5%.
- What they checked: They calculated AOV – CPA and saw negative margin.
Takeaway: Never optimize CPA in isolation. Always pair it with AOV to see if the cost is justified.
How they work together
AOV is the better lens when your goal is to increase revenue per transaction. Use it to test upsell flows, minimum order thresholds, or product bundles.
CPA is the better lens when your goal is to control ad spend. Use it to compare channel efficiency, set bid caps, or evaluate new audience segments.
Use both when you need to assess unit profitability. The simple formula: Profit per customer = AOV – CPA. If CPA > AOV, you're losing money on every sale.
Side-by-side snapshot
| Lens | AOV | CPA |
|---|---|---|
| Formula | Total Revenue / Orders | Total Ad Spend / Conversions |
| What it tells you | How much each buyer spends | How much you paid to get them |
| Optimization goal | Increase (higher is better) | Decrease (lower is better) |
| Typical use case | Product bundling, upsell, pricing | Channel selection, bid management, budget allocation |
| Profit impact | Directly increases margin | Directly reduces margin |
Common pitfalls
Confusing AOV with Profit
AOV is not profit. It's revenue before costs (COGS, shipping, returns).
- What to do instead: Calculate net contribution = AOV – COGS – CPA – other variable costs.
Optimizing CPA Without Considering AOV
A low CPA is useless if AOV is even lower.
- What to do instead: Always evaluate CPA relative to AOV. A healthy ratio is AOV > CPA by a comfortable margin.
For learning only. Not advice on bids or spend.
You may also like
Metrics
Average Order Value (AOV)
Average Order Value (AOV) measures the average revenue generated per order placed.
ValueMetrics
Cost Per Acquisition (CPA)
Cost Per Acquisition (CPA) measures the total advertising cost divided by the number of convers…
CostRelationships
CTR vs IVT Rate
RelationshipsRelationships
ARPU vs Session RPM
Relationships