#relationships·Jul 17, 2026·6 min read
Ad Density vs RPM: Balancing User Experience and Revenue
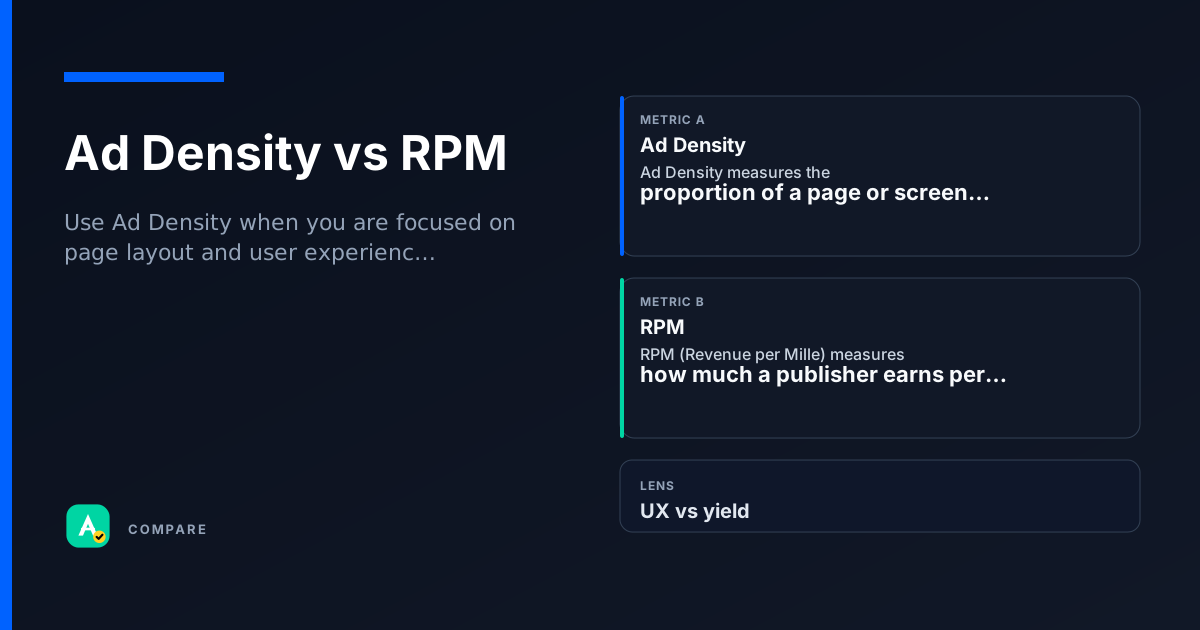
Ad Density measures the ratio of ad space to total content on a page. RPM (Revenue Per Mille) tells you how much revenue you earn per thousand page views. One controls layout, the other measures earnings.
Core Difference: Layout vs Revenue
Ad Density is a design metric: the percentage of a page occupied by ads. RPM is a financial metric: total earnings per 1,000 page views.
- Ad Density = ad area / total content area × 100
- RPM = (estimated earnings / page views) × 1,000
Why it matters
- High ad density can hurt user experience and page speed.
- RPM can be high even with low density if ads are well-targeted.
- They are not directly linked: you can have low density and high RPM, or vice versa.
Which to use when
Use Ad Density when:
- You are redesigning a page layout.
- You need to comply with Better Ads Standards (e.g., avoid high density on mobile).
- You want to test how ad load affects bounce rate.
Use RPM when:
- You are comparing revenue across different pages or periods.
- You need to evaluate overall monetization efficiency.
- You are reporting to stakeholders on financial performance.
Use both together when:
- You want to find the sweet spot between user experience and revenue.
- You are A/B testing ad placements and need to measure both impact and earnings.
How they diverge
What they measure
Ad Density measures space (ad area / total area). RPM measures money (earnings per 1,000 views).
- Ad Density: unit = percentage
- RPM: unit = currency (e.g., USD)
Impact on user experience
Ad Density directly affects user experience (clutter, load time). RPM does not — high RPM can come from a clean layout with premium ads.
- High density → higher bounce risk
- High RPM → no direct UX impact
Optimization levers
Ad Density is optimized by reducing ad slots or resizing ads. RPM is optimized by improving ad targeting, increasing CPM, or boosting viewability.
- Density: layout changes
- RPM: demand-side changes
Where they overlap
Both are aggregate metrics
Neither metric tells you about a single ad’s performance. They summarize the whole page or site.
Both are used in A/B testing
Publishers often track both when testing new ad layouts to see if revenue changes are worth the UX trade-off.
Both can be segmented
You can calculate Ad Density and RPM per page, per device, or per ad unit to find underperformers.
Real scenarios
High density, low RPM
A news site loads 8 ad units per page but earns only $2 RPM.
- What happened: Too many low-CPM ads cluttered the page.
- What they checked: Ad Density was 35% (above recommended 30%). RPM was low because ads were poorly targeted.
Takeaway: Reducing ad slots (lower density) and improving targeting can raise RPM while improving UX.
Low density, high RPM
A niche blog uses 2 premium ad slots and earns $15 RPM.
- What happened: Few ads, but high viewability and CPM.
- What they checked: Ad Density was 8%. RPM was high due to premium demand.
Takeaway: Low density can still yield high RPM if ads are well-placed and targeted.
How they work together
Use Ad Density when you are focused on page layout and user experience. It helps you avoid violating ad density limits (e.g., Google’s Better Ads Standards).
Use RPM when you need to compare revenue performance across pages, time periods, or ad networks. It’s the standard metric for monetization efficiency.
Use both when you are optimizing for revenue without harming UX. For example, A/B test a layout change: track Ad Density to ensure compliance and RPM to measure revenue impact.
Side-by-side snapshot
| Lens | Ad Density | RPM |
|---|---|---|
| Definition | Percentage of page area occupied by ads | Revenue per 1,000 page views |
| Unit | Percentage (%) | Currency (e.g., USD) |
| Optimization lever | Reduce ad slots or resize ads | Improve targeting, increase CPM |
| Impact on UX | Direct (high density = poor UX) | Indirect (via ad quality) |
| Common use case | Layout design, compliance | Revenue reporting, network comparison |
Common pitfalls
Confusing density with revenue potential
Some publishers think more ads = more money. That’s wrong.
- What to do instead: Focus on ad quality and placement rather than just adding slots. Use RPM to validate whether density changes actually increase earnings.
Ignoring density when optimizing RPM
RPM can be high temporarily due to a single high-CPM campaign, but if density is excessive, user retention drops.
- What to do instead: Always monitor Ad Density alongside RPM to ensure long-term sustainability.
Quick check
Test whether you can tell these metrics apart.
boolean
Ad Density is measured in currency (e.g., USD).
Select an answer to continue
For learning only. Not advice on bids or spend.
You may also like
Metrics
Ad Density
Ad Density measures the proportion of a page or screen area occupied by ads versus content.
UXMetrics
Revenue per Mille (RPM)
RPM (Revenue per Mille) measures how much a publisher earns per thousand page views or sessions.
RevenueRelationships
CTR vs Viewability
RelationshipsRelationships
CAC vs ROAS
Relationships