#relationships·Jul 17, 2026·6 min read
AOV vs ROAS: Which Metric Should You Optimize For?
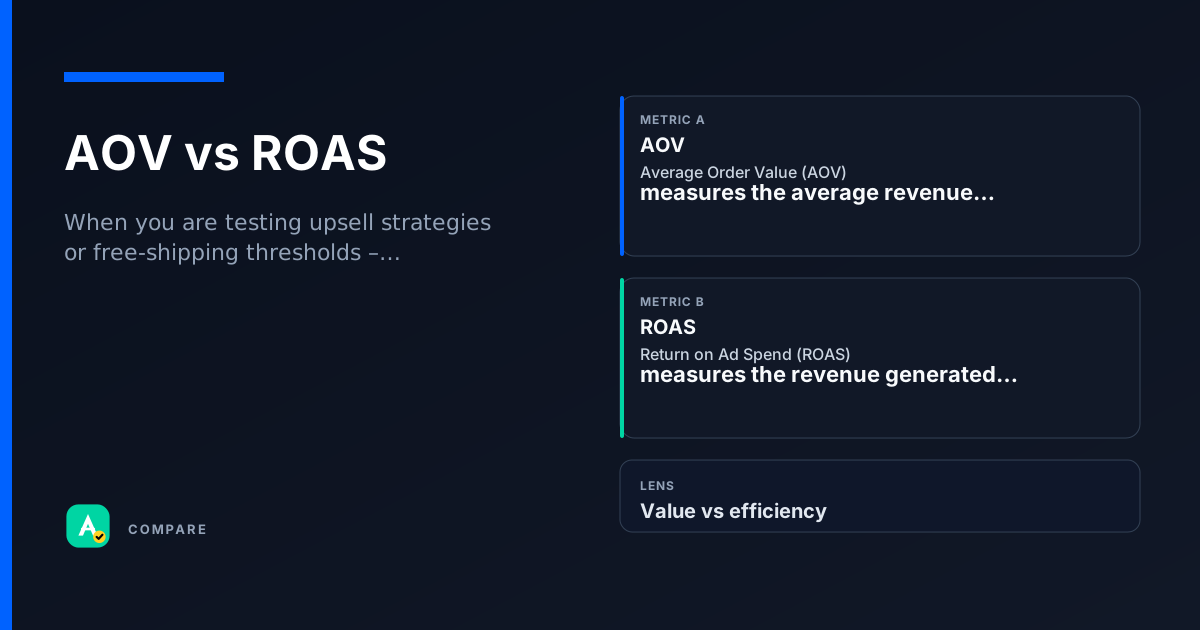
AOV (Average Order Value) measures the average amount spent per transaction. ROAS (Return on Ad Spend) measures the revenue generated for every dollar spent on advertising. Both are critical for e‑commerce, but they answer different questions about your business health.
Core Difference: Transaction Value vs. Campaign Efficiency
AOV = Total Revenue / Number of Orders
ROAS = Revenue from Ads / Cost of Ads
- AOV focuses on what happens after the click – how much a customer buys in one go.
- ROAS focuses on the advertising efficiency – how much revenue each ad dollar generates.
Why it matters
- A high AOV can mask low ROAS if ad costs are too high.
- A high ROAS can hide a low AOV if customers buy cheap items repeatedly.
Which to Use When
Pick AOV when:
- You want to increase basket size (upsells, cross‑sells, bundles).
- You are testing pricing strategies or minimum order thresholds.
- You need to understand purchase behavior per transaction.
Pick ROAS when:
- You are evaluating ad campaign profitability.
- You compare channels (Google Ads vs. Meta) for budget allocation.
- You need a quick efficiency benchmark (e.g., 4:1 ROAS target).
Use both together when you want to see if a campaign drives high‑value orders (high AOV) and does it cost‑effectively (high ROAS).
How they diverge
What They Measure
- AOV: Average revenue per order.
- ROAS: Revenue per ad dollar spent.
Calculation
- AOV: Total Revenue / Number of Orders.
- ROAS: Revenue from Ads / Cost of Ads.
Primary Use Case
- AOV: Optimize pricing, bundling, upselling.
- ROAS: Optimize ad spend, channel mix, campaign ROI.
Where they overlap
Revenue‑Based
Both use revenue as the numerator – they don't account for profit margins.
E‑Commerce Focus
Both are most commonly used in online retail to gauge performance.
Segmentable
Both can be broken down by campaign, channel, product, or customer segment.
Real scenarios
The Upsell Campaign
Setup: An e‑commerce store runs a campaign offering a 10% discount on orders over $50.
- What happened: AOV increased from $35 to $52, but ROAS dropped from 5:1 to 3:1 because the discount ate into revenue.
- What they checked: AOV showed the strategy worked; ROAS revealed the cost.
Takeaway: Use AOV to measure basket growth, but pair it with ROAS to ensure the growth is profitable.
The Channel Shift
Setup: A brand shifts 50% of its budget from Google Shopping to TikTok Ads.
- What happened: ROAS on TikTok was 6:1 vs. Google’s 4:1, but AOV on TikTok was $28 vs. Google’s $55.
- What they checked: ROAS alone would suggest TikTok is better; AOV revealed TikTok customers bought cheaper items.
Takeaway: ROAS can be misleading if you ignore AOV – high ROAS on low‑value orders may not be sustainable.
How they work together
When you are testing upsell strategies or free‑shipping thresholds – AOV tells you if customers are adding more items.
When you need to decide which ad channel to scale – ROAS shows which channel gives the best revenue per dollar.
When you run a new product launch – high AOV + high ROAS means the campaign is both efficient and drives big baskets.
Side-by-side snapshot
| Lens | AOV | ROAS |
|---|---|---|
| Formula | Total Revenue / Number of Orders | Revenue from Ads / Cost of Ads |
| Tells You | How much customers spend per transaction | How efficiently ads generate revenue |
| Optimization Focus | Pricing, bundling, upselling | Ad creative, targeting, bid strategy |
| Common Target | Increase by 10–20% YoY (varies by industry) | 4:1 or higher (varies by margin) |
| Limitation | Ignores ad cost and profit margin | Ignores order value and profit margin |
Common pitfalls
Confusing AOV with Profitability
A high AOV does not mean high profit – the items may have low margins or high return rates.
- What to do instead: Track profit per order (revenue – COGS – shipping) alongside AOV.
Confusing ROAS with ROI
ROAS uses revenue, not profit. A 4:1 ROAS may still lose money if margins are thin.
- What to do instead: Calculate POAS (Profit on Ad Spend) = (Revenue – COGS) / Ad Cost.
Quick check
Test whether you can tell these metrics apart.
boolean
AOV is calculated as Total Revenue divided by Number of Orders.
Select an answer to continue
For learning only. Not advice on bids or spend.
You may also like
Metrics
Average Order Value (AOV)
Average Order Value (AOV) measures the average revenue generated per order placed.
ValueMetrics
Return on Ad Spend (ROAS)
Return on Ad Spend (ROAS) measures the revenue generated for every dollar spent on advertising.
PerformanceRelationships
Bid Response vs Floor Price
RelationshipsRelationships
CVR vs Engagement Rate
Relationships